

Abstract
U.S. manufacturing labour productivity growth fell from roughly 3.5 per cent per year over 1987–2007 to near zero over 2010–2022. Growth in total factor productivity (TFP) also fell to near zero over the same period. This article examines the sources of that slowdown by decomposing manufacturing productivity growth into contributions from leader and follower firms within frontier and laggard industries. We find that the slowdown is broad-based: both for labour productivity and TFP, productivity growth declined among both leaders and followers, across alternative weighting methods, and multiple industry groupings. Standard models of economic growth treat research and development (R&D) as the primary channel through which firms generate productivity growth. The broad-based nature of the slowdown raises the question of whether the translation of R&D expenditures into productivity gains has weakened. We estimate an R&D production function at both the industry and firm levels and find that the elasticity of productivity with respect to R&D is consistently larger in the earlier period than in the full sample, even as R&D expenditure has risen across firms and industries. These results suggest that the slowdown reflects declining research productivity rather than reduced innovation effort.
1. Introduction
Historically, the U.S. manufacturing sector has been a pivotal driver of aggregate productivity growth, with labour productivity, defined as output per hour, growing at over 2 per cent per year through most of the twentieth century. More recently, however, manufacturing has experienced a pronounced productivity slowdown. Labour productivity fell from roughly 3.5 per cent growth per year over 1987–2007 to near zero over 2010–2022. Growth in total factor productivity (TFP, which is the residual output after accounting for labour, capital, and intermediate inputs), fell from roughly 1.3 per cent to near zero over the same periods. This slowdown is part of a broader deceleration in aggregate labour productivity across the U.S. economy (Fernald, 2015; Syverson, 2017; Byrne et al., 2016; Sharpe and Chittoor, 2025; Atalay et al., 2025) and is particularly puzzling given that the manufacturing sector still accounts for the majority of private-sector research and development (R&D) expenditures (Lashkari and Pearce, 2024).
The existing literature points to several possible sources. Industry-level analyses emphasize the role of leading sectors, in particular Computer and electronic products (North American Industry Classification System, or NAICS, 334), whose rapid productivity growth in the late 1990s and early 2000s has collapsed after the Great Recession (Atalay et al., 2025; Syverson, 2017). Firm-level accounts, including those that emphasize divergence between frontier firms and others, suggest that the slowdown should be concentrated in follower firms that are falling behind. In many of those theories, the frontier firms continue to advance (Andrews et al., 2015; Aghion et al., 2023; Andrews et al., 2019; Akcigit and Ates, 2023; Olmstead-Rumsey, 2022). This “best-versus-rest” narrative has become an influential framing of the productivity slowdown, linking it to rising dispersion between frontier and laggard firms. In contrast, the competing “ideas getting harder to find” hypothesis implies a broad-based slowdown affecting all firms and industries, perhaps roughly in proportion to their research intensity (Bloom et al., 2020).
Two natural questions emerge from this literature. First, is the slowdown broad-based across categories of firms and industries, or is it concentrated in particular groups? Second, how is the slowdown reflected in R&D activity: is R&D spending itself declining, or is R&D becoming less effective at generating productivity growth?
This article addresses both questions by extending our previous work along several dimensions. In Lashkari and Pearce (2026), we introduce a decomposition framework that links firm-level information from Compustat to industry-level aggregates from the U.S. Bureau of Labor Statistics (BLS) and study the trends in R&D intensity and productivity. The present article extends that analysis in three ways. First, we broaden the industry split beyond NAICS 334 to a wider set of frontier industries. Second, we broaden the definitions of leader firms to include both revenue and productivity definitions of leadership. Third, we move beyond documenting the R&D–productivity disconnect and directly estimate the changes in the relationship between R&D spending and subsequent productivity growth at both the industry and firm levels.
Our first finding is that the slowdown is broad-based across frontier and lagging industries and across firms. When leader firms within each industry are defined by employment or revenue, which are both relatively persistent measures of firm size, both leaders and followers slow down. This result holds across different weighting methods, both for labour productivity and TFP, and across multiple industry splits. The main exception emerges when classifying leader firms by productivity, a more volatile measure. Under this alternative definition, the most productive firms do not slow down, but these firms are not particularly large in terms of employment and revenue, which limits their contribution to the aggregate slowdown (Section 3.4).
Turning to R&D patterns, we provide evidence that the productivity payoff to R&D spending has weakened over time. We first show that R&D intensity broadly rose across firms and industries, even as productivity growth declined. Because R&D is the primary channel through which firms invest in future productivity, this disconnect motivates a direct test of whether the translation of R&D expenditures into productivity gains has weakened. Estimating an R&D production function at both the industry and firm levels, we find that the elasticity of productivity with respect to R&D is consistently larger in the pre-period (1987–2006) than in the full sample (1987–2022), a pattern that holds across both productivity measures (TFP, labour productivity), different specifications, and multiple weighting schemes. These patterns are consistent with the “ideas getting harder to find” hypothesis and suggest that the slowdown may stem from shifts in the nature of the R&D process rather than changes in innovation effort.
2. Data and Measurement
This article begins by documenting aggregate trends and then decomposes them using more detailed firm- and industry-level data. We decompose aggregate manufacturing productivity into contributions across two groups of firms within each industry, which we label leader and follower firms, and across two groups of industries, which we refer to as frontier and laggard industries.
We consider three definitions for leader firms: employment (the baseline, capturing a fairly persistent proxy for size of inputs), revenue (highly correlated with employment but proxying size of output), and productivity (similar to the definition considered by Andrews et al. (2019) in the ‘best-versus-rest’ narrative). We use the average of the previous and current period (period-average) weights as the baseline and find similar results using either current-period and previous-period weights. We study the top-four frontier industries defined by labour productivity growth in the pre-period, 1987–2007, which are Textile mills (NAICS 313), Computer and electronic product manufacturing (NAICS 334), Electrical equipment, appliance and component manufacturing (NAICS 335) and Transportation equipment manufacturing (NAICS 336). In the Appendix, we provide additional details for NAICS 334 as the sole frontier industry. We evaluate both labour productivity and TFP throughout the analysis. The reason for these different splits is to understand how pervasive the slowdown is given different productivity definitions and different cuts of the data.
2.1 Data Sources
Our analysis bridges industry-level and firm-level data for U.S. manufacturing (NAICS 31–33) over the 1987–2022 period. At the industry level, we draw on the BLS detailed industry productivity accounts (Bureau of Labor Statistics, 2025a,b) at NAICS 4-digit level, which provide labour productivity and TFP indices (both 2017=100), hours worked, sectoral output, and output price deflators. The BLS indices incorporate detailed-industry deflators, including hedonic adjustments for NAICS 334. At the firm level, we use Compustat North America (Standard & Poor’s, 2025), drawing on revenue, employees, PP&E (Property, Plant, & Equipment), R&D (Research & Development), and cost of goods sold, restricting the sample to firms with non-missing employment and revenue and dropping bare 2-digit NAICS codes. For PP&E, we use historical prices consistent with financial statements and the existing R&D data come from U.S. Bureau of Economic Analysis (BEA) fixed-asset investment by industry (U.S. Bureau of Economic Analysis, 2025) and from Compustat at the firm level.
We deflate Compustat revenues by BLS NAICS 3-digit gross-output deflators, capital by major industry capital deflators, and R&D by college-educated male wages (Bloom et al., 2020; U.S. Census Bureau, 2025). Details are in Appendix A.
To bridge the two data sources, we build explicit aggregations from the firm to the industry level and from the industry level to the level of the entire manufacturing sector. The firm-to-industry aggregation uses employment-share weights for labour productivity and revenue-share weights for TFP; industry-to-aggregate aggregation uses BLS hours shares for labour productivity and nominal output shares for TFP (see Appendix B.1 for details on the log-additive aggregation procedure). We construct aggregate manufacturing TFP as the weighted average of NAICS-4 digit industry TFP growth rates, with each industry weighted by its period-average share of total nominal manufacturing gross output. This procedure more closely aligns with how BLS calculates (sectoral output) TFP, and closely tracks the aggregate in Figure 1.1 As we show below, the BLS and Compustat measures are closely aligned, which enables more granular analysis: the firm-level data can be used to decompose the industry-level trends without introducing measurement discrepancies.
2.2 Time Periods, Industries, and Firm Groups
This analysis primarily focuses on two time periods: the high-growth period (the pre-period) in manufacturing (1987–2007) and the low-growth period (2010–2022). We exclude the Great Recession years 2008–2009. We thus reference 1987 as the initial date for the analysis. We then partition the data along two dimensions: an industry dimension that separates high-growth frontier industries from the rest of manufacturing, and a firm dimension that separates leaders from followers within each industry.
The firm and industry partitions serve as the main cuts of our analysis. The baseline industry split defines the top four NAICS 3-digit sectors by pre-period labour productivity growth as frontier industries, with the rest of manufacturing as laggard industries; see Section 3.2. As a robustness check, we also consider a narrower split that isolates Computer and electronic product manufacturing, which is by far the fastest-growing industry over 1987–2007 (Atalay et al., 2025), as the sole frontier industry (Appendix C.2).
As for the two firm types, within each 4-digit NAICS code-year cell, we classify the top 10 per cent of firms as leaders (or the single largest firm if fewer than 10 are present); the remainder are followers. We consider three ranking variables. Employment (the baseline) captures scale and is persistent over time; revenue captures market position and is highly correlated with employment. Both are more persistent than productivity rankings (Pearce and Wu, 2025). Productivity (labour productivity or TFP) captures the technological frontier but is much less persistent: smaller firms are often the most productive. For defining leaders, we base our measure on an average of the current and previous period.
2.3 Productivity and R&D
We measure labour productivity at the firm level as deflated revenue per employee. At the industry level, we use the BLS labour productivity index (2017=100) and the BLS Total Factor Productivity index. These measures are relevant for our industry analysis.
For firm-level TFP, we follow the same approach used by De Ridder et al. (2026), who estimate a gross-output production function with two inputs: a variable input (cost of goods sold, absorbing both materials and labour payments) and a fixed input (net PP&E). Specifically, we define:
where is deflated revenue, is deflated cost of goods sold, is deflated net PP&E, and the elasticities are estimated at the NAICS 3-digit industry codes following the De Ridder et al. (2026) procedure. As for the industry-level productivity measures, we directly use the BLS TFP Index rather than aggregating firm-level estimates, so that industry-level productivity in the R&D regressions (Section 4) is measured independently of the Compustat data.
We measure R&D intensity as real R&D per worker, or R&D relative to revenue. These measures are discussed in greater detail in Section 4. For R&D expenditures, the BEA only provides details at the NAICS 3-digit level as far as we are aware. In order to get more granular industry analysis, we extend to NAICS 4-digit level using Compustat data.
3. Productivity Trends across Firms and Industries
This section documents the aggregate manufacturing productivity slowdown and decomposes its drivers at the industry and firm levels. Using the four-group framework introduced in Section 2, we examine whether the slowdown is concentrated in particular groups or spread across the distribution. The central finding is that the slowdown is pervasive: under size-based rankings (employment or revenue), both leaders and followers slow down. Section 3.4 examines the alternative productivity-based ranking, which yields a different pattern.
3.1 Aggregate Slowdown
We begin by documenting the aggregate slowdown. Figure 1 plots labour productivity and TFP indices for both BLS and Compustat, each initialized to 100 in 1987. For our BLS series (Figures 1A and 1C), we plot our industry-level aggregation, with current shares and fixed shares as well as the two BLS aggregates for labour productivity and TFP. We find that our aggregation shows a very similar trend to the BLS aggregate manufacturing method.
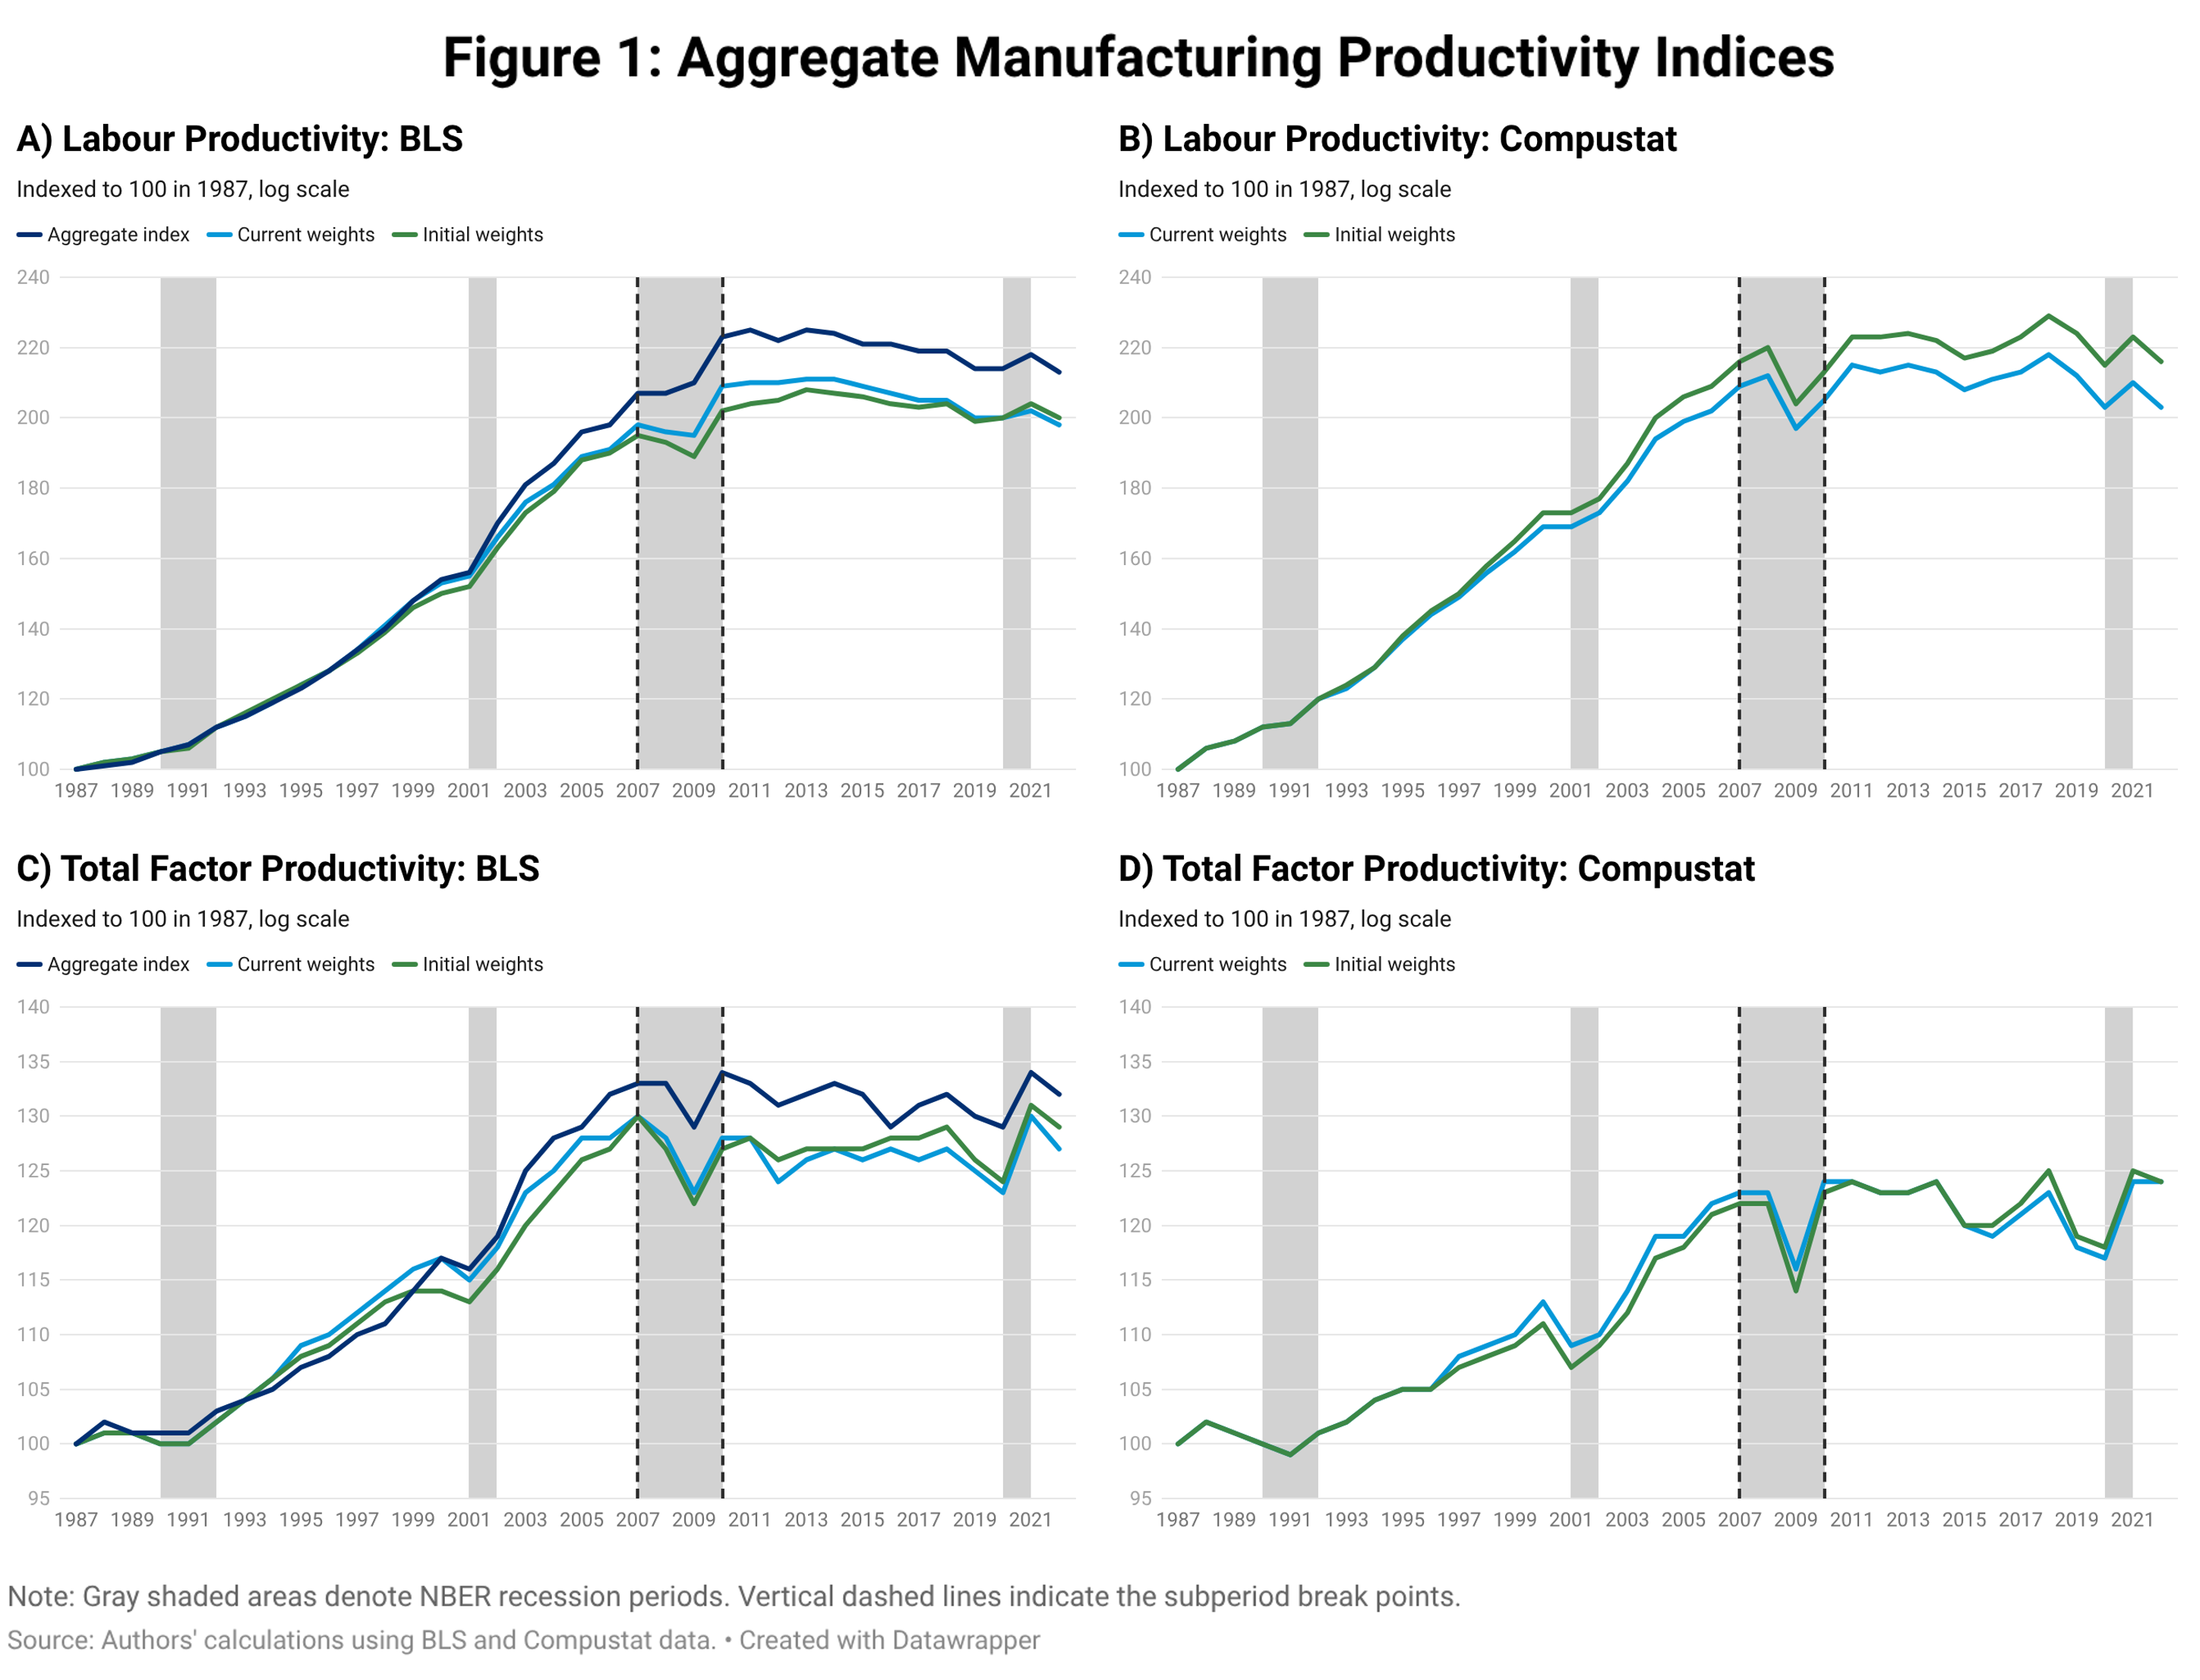
The picture is striking: labour productivity grew at an annualized rate of roughly 3.5 per cent per year over the 1987–2007 period, approximately doubling in level by 2007, and then stagnated, with annualized growth falling to near zero over the 2010–2022 period. TFP grew at roughly 1.3 per cent per year through 2007 and then flattened. The slowdown is visible in every panel of Figure 1: all productivity indices rise steeply through the pre-period, and the change in slope around 2007 marks the onset of the slowdown across both productivity measures and both data sources. The two data sources are closely aligned under both measures, confirming that the Compustat sample of publicly traded firms captures the same broad trends as the BLS universe.
Table 1 quantifies the slowdown. Annualized labour productivity growth fell by roughly 4 percentage points from the pre-period (1987–2007) to the post-period (2010–2022), whether measured from BLS or Compustat. TFP slows by 1.1–1.4 percentage points, consistent with the labour productivity pattern but more muted. Both BLS and Compustat TFP are near zero or slightly negative in the post-period. Which firms and industries account for the flattening?
3.2 Within-Group Trends
We start by focusing on industry- and firm-level splits in accumulated growth from 1987–2022. This section focuses on overall trends and average growth within each group before turning to each group’s contribution to aggregate productivity growth, which depends on its size.
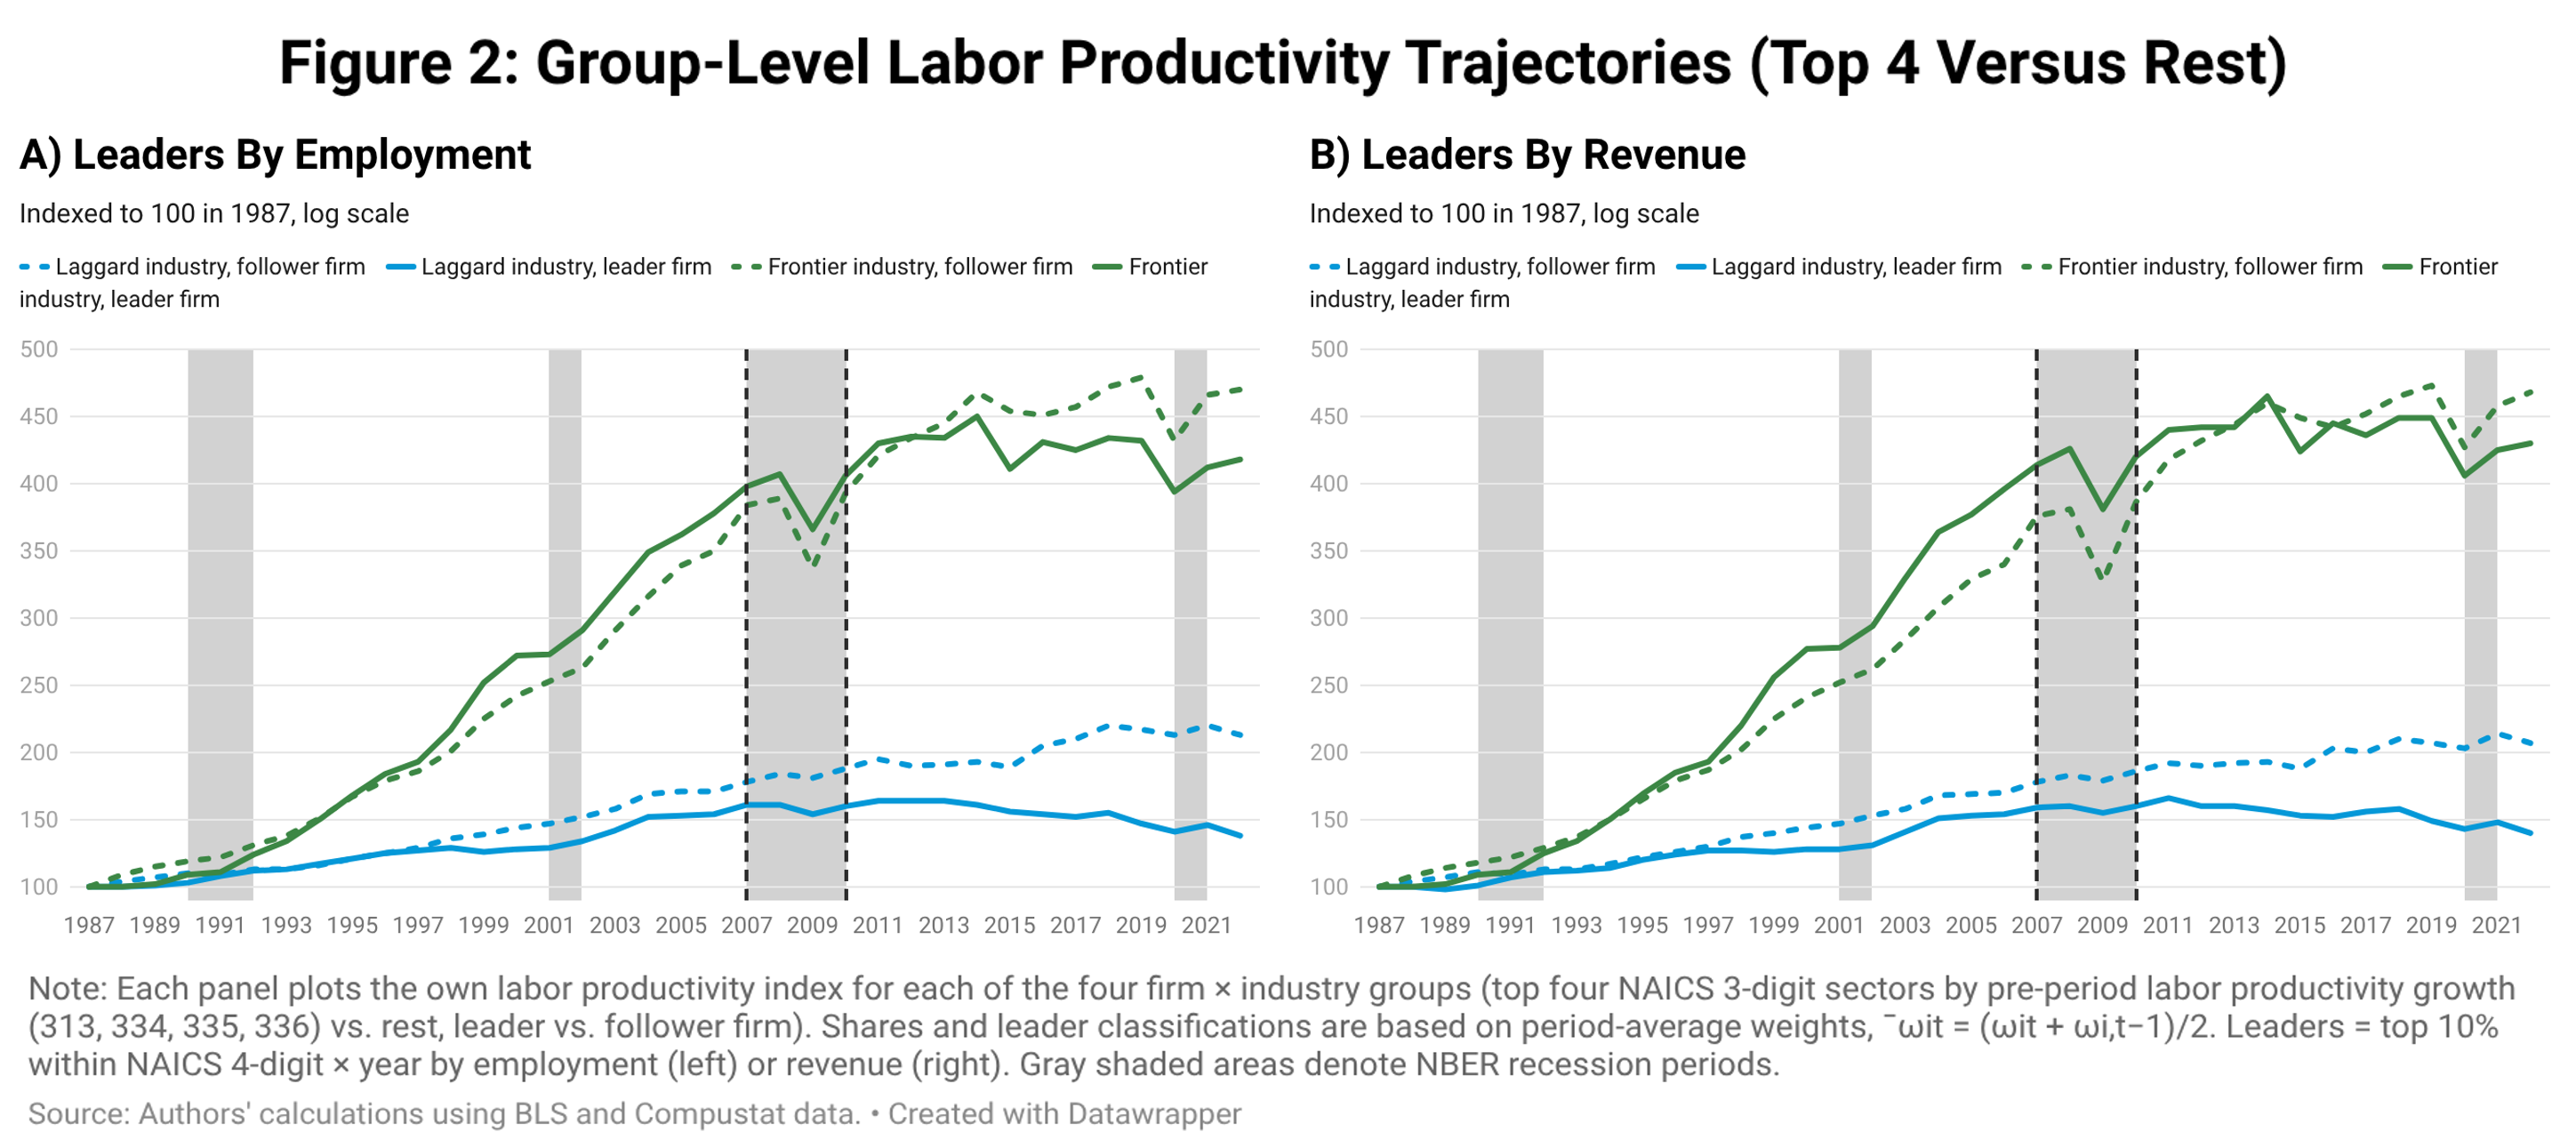
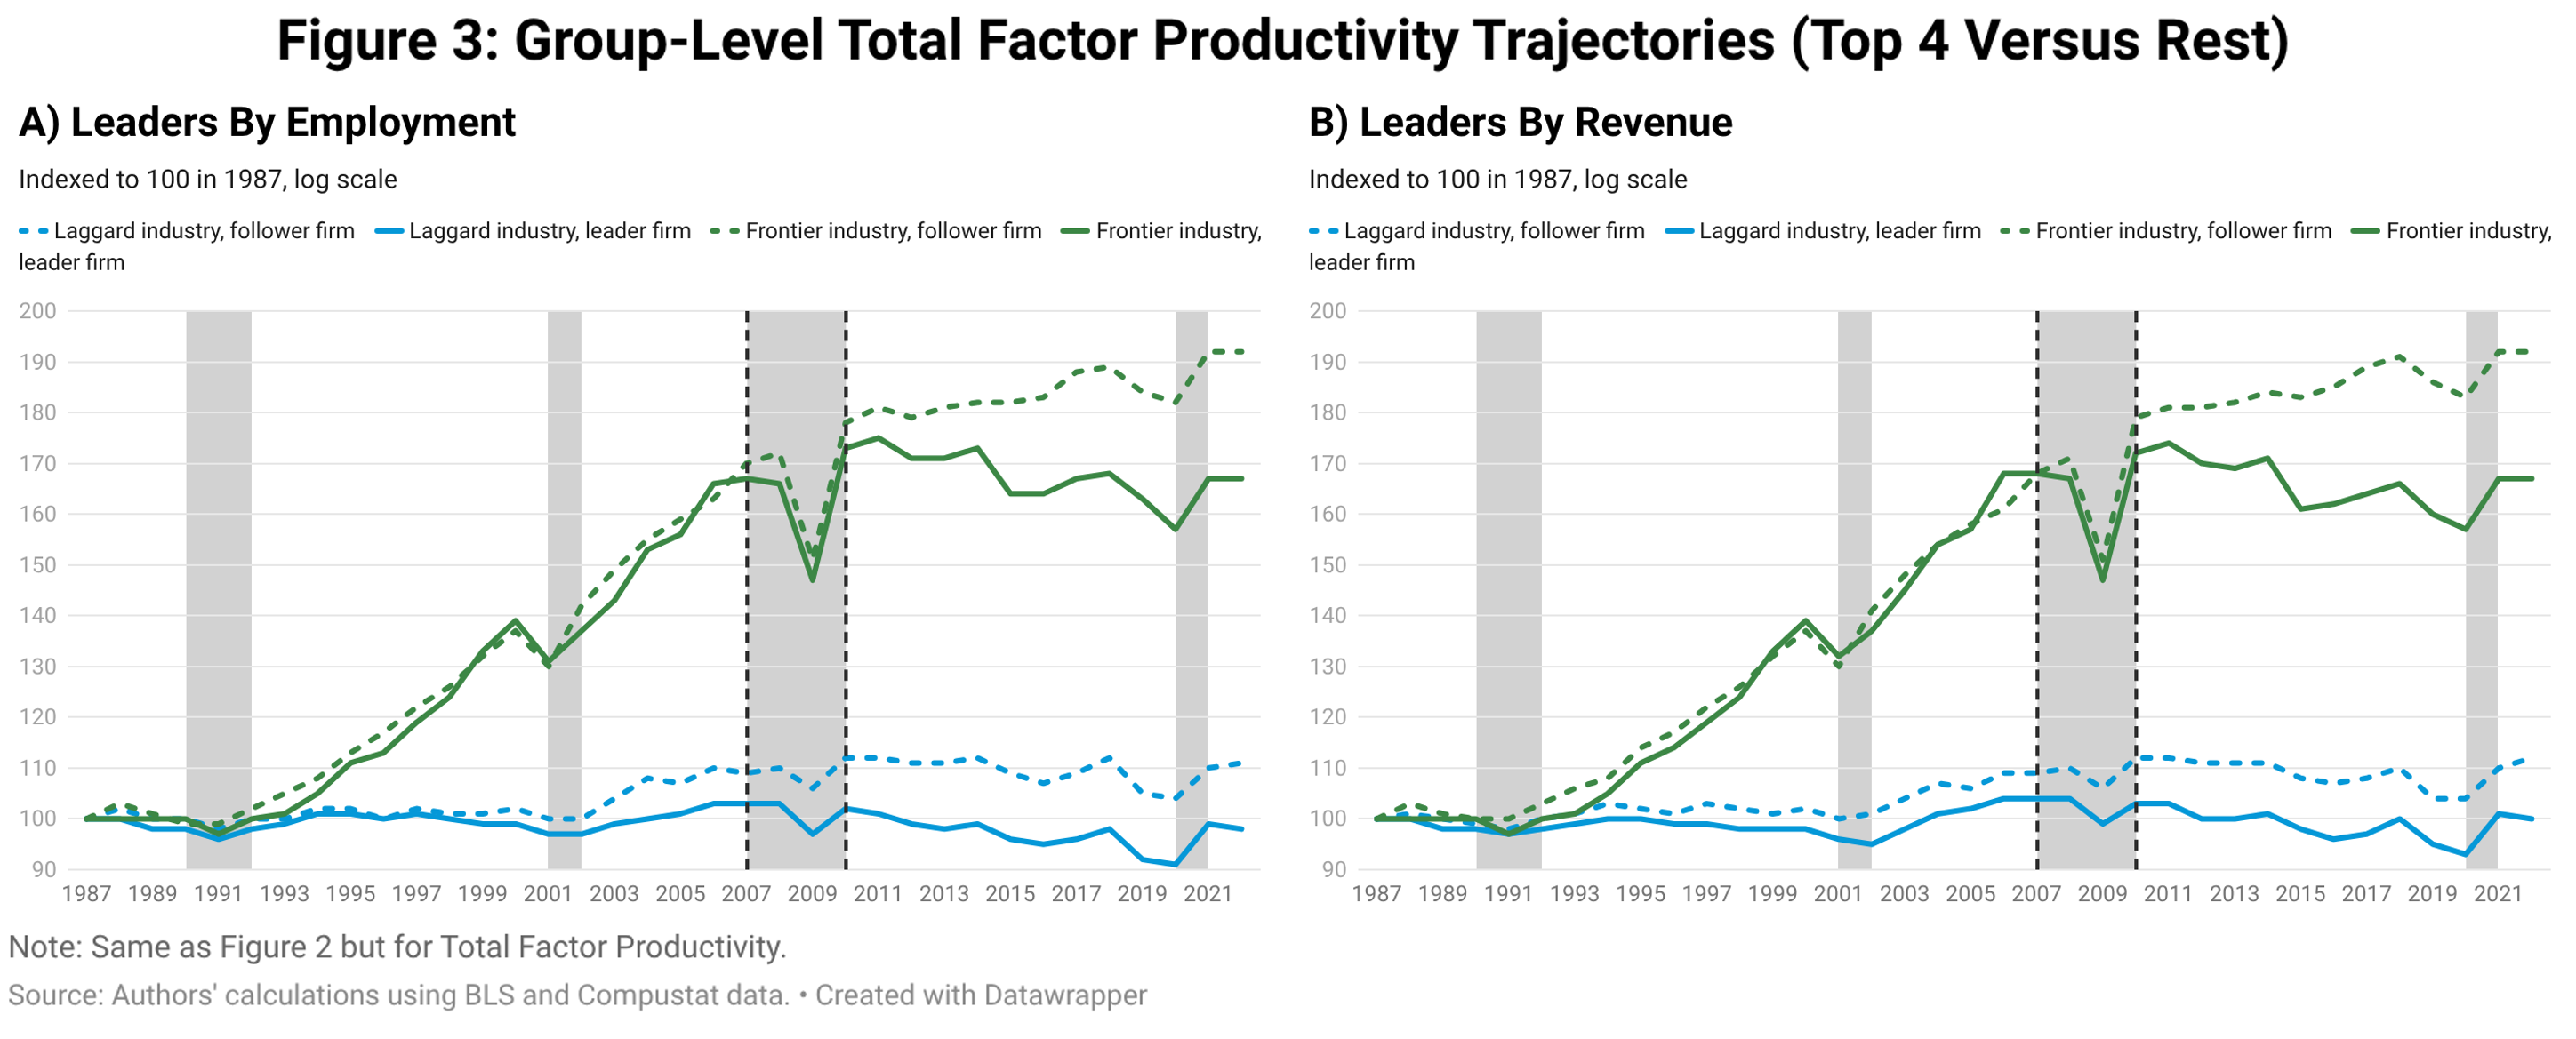
Figures 2 and 3 plot each group’s own labour productivity and TFP trajectories under period average weights for employment- and revenue-ranked leaders, using the top four frontier industries versus the rest. The common trend is immediately apparent: all four groups (leader and follower firms in both the frontier and laggard industry) rise together through the pre-period and flatten together after 2007. No single group pulls away or collapses on its own. The narrower 334-only industry split yields qualitatively similar results (Appendix C.2). Section 3.4 examines what happens when leaders are instead defined by productivity. The qualitative results are the same under different weightings and leading firm definitions (see Appendix C.1 and Figure 12 for additional robustness checks).
Table 2 reports within-group growth rates for the top four versus rest industry split. Under employment rankings (Table 2), all four groups slow down. The frontier industries (both leaders and followers) grew rapidly in the pre-period and then sharply decelerated. Leaders and followers in laggard industries also slowed. For TFP, the pattern is qualitatively similar: frontier firms slowed substantially while laggard-industry firms slowed more modestly. The slowdown is present in both leaders and followers in laggard industries.
3.3 Decomposing the Aggregate Slowdown
The trajectory figures show that all groups slow down in productivity, but these groups differ in their contribution to aggregate growth in manufacturing. To assess how much each group contributes to the aggregate slowdown, we next turn to decompositions of aggregate productivity to each of these groups.
Figure 4 presents the central result for the top four industries versus rest split. Each panel shows the decomposition of aggregate labour productivity. The visual message mirrors the trajectories: all four bands rise together and flatten together. Both leaders and followers contribute to the rise and to the subsequent stagnation. Figure 5 repeats the exercise for TFP; the same pattern holds throughout. The narrower 334-only split yields qualitatively similar results (Appendix C.2). These patterns persist across different weighting methods (see Appendix C.1, Figures 9–10 for current-period, previous-period, and period-average weights side by side).
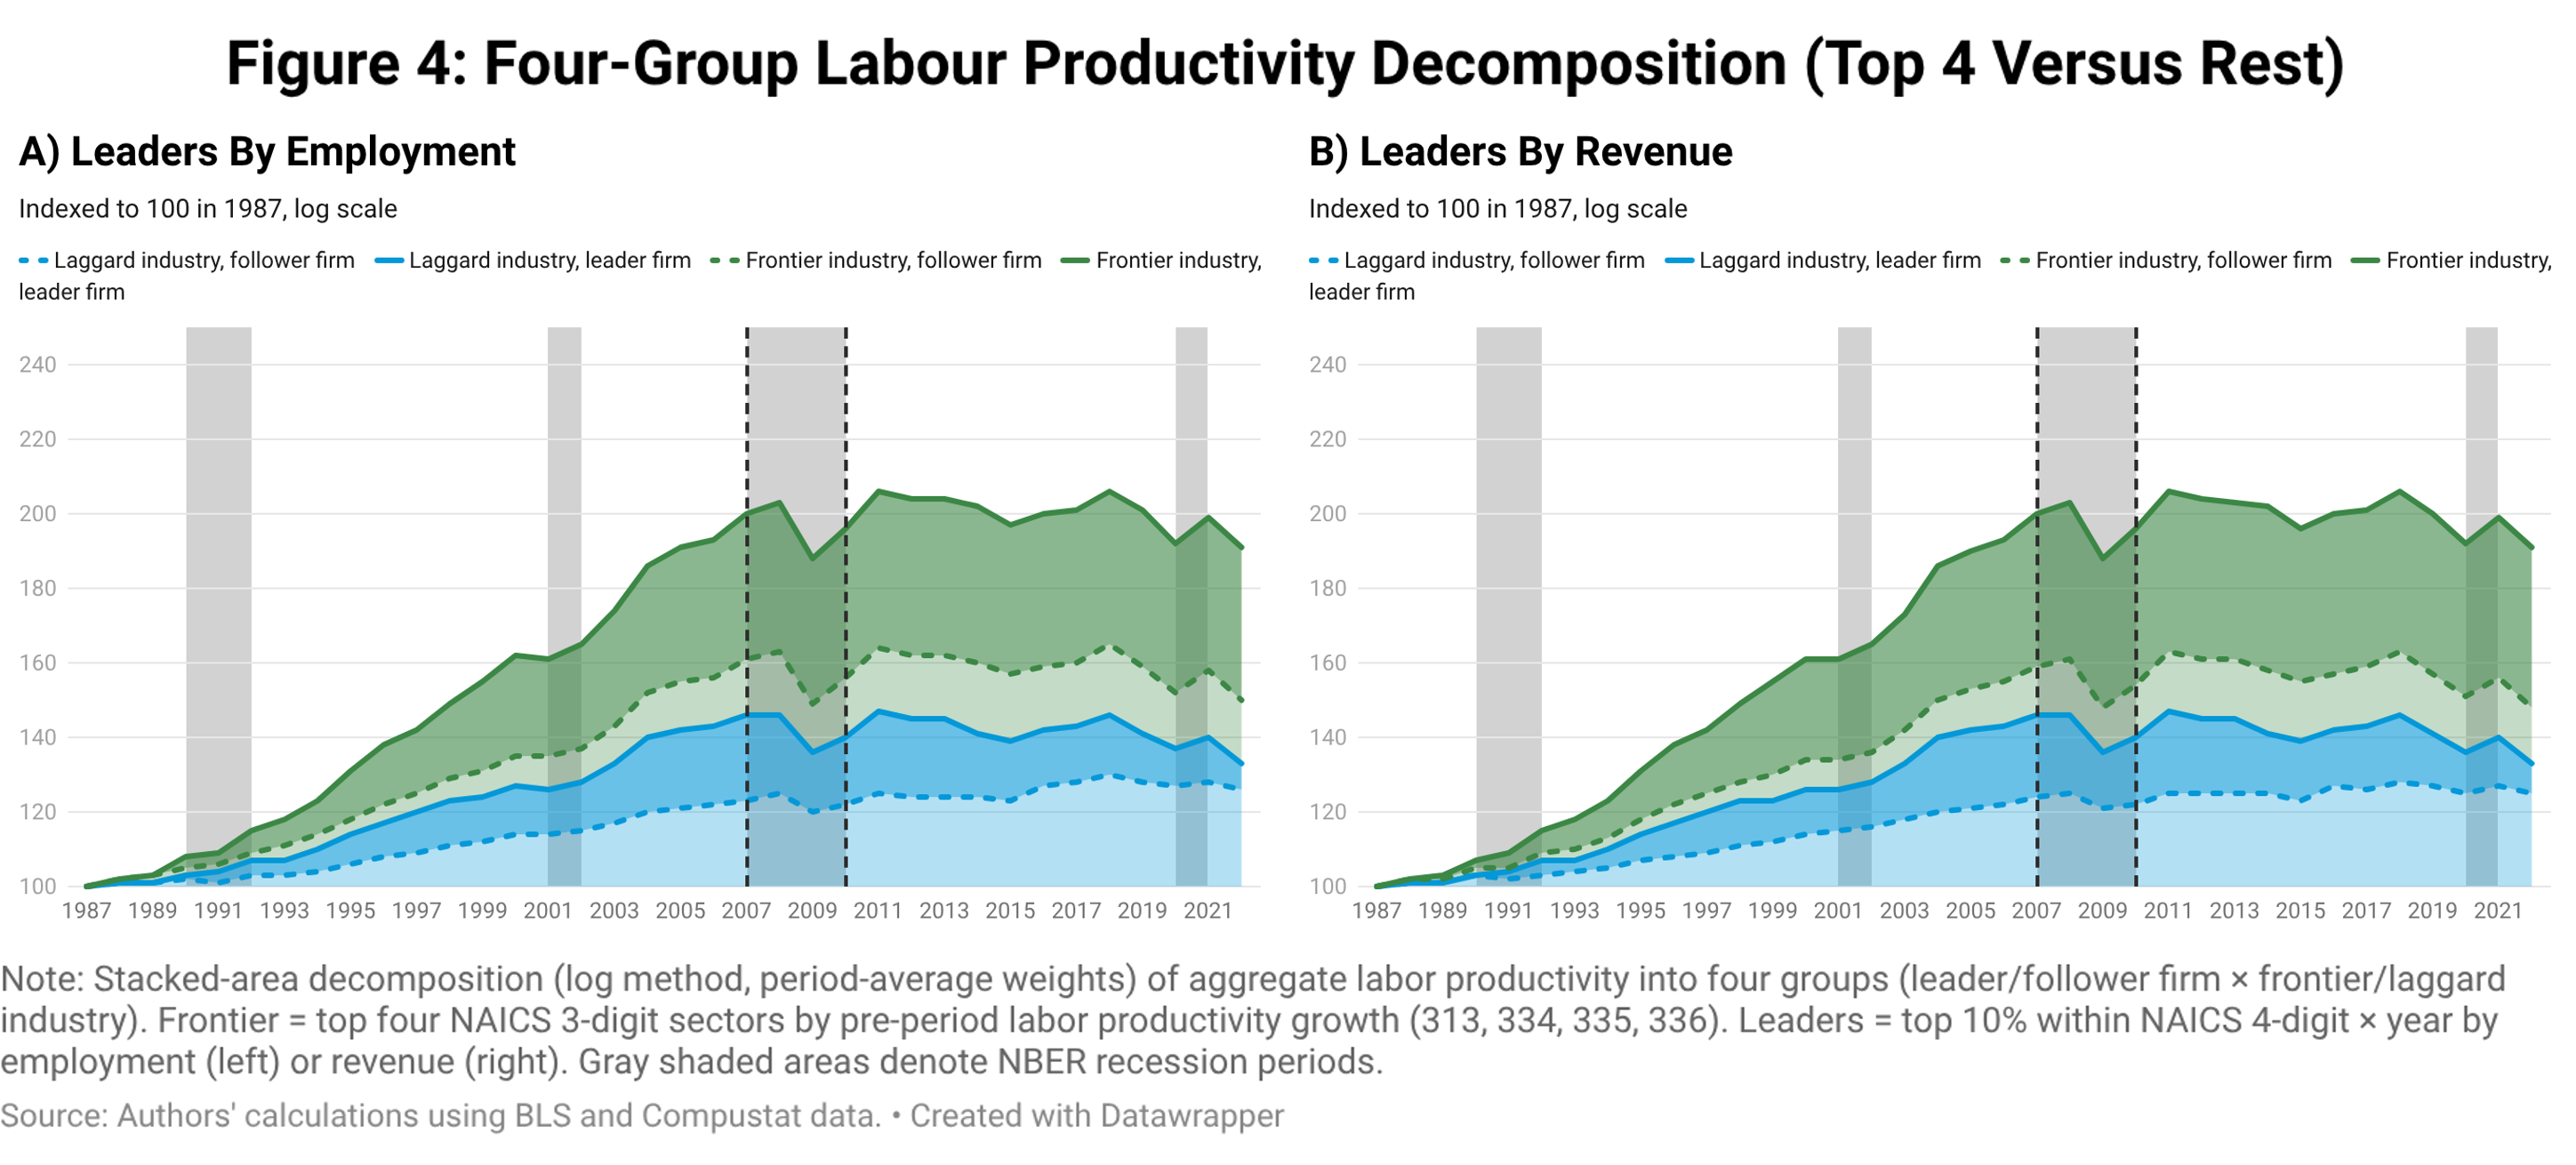
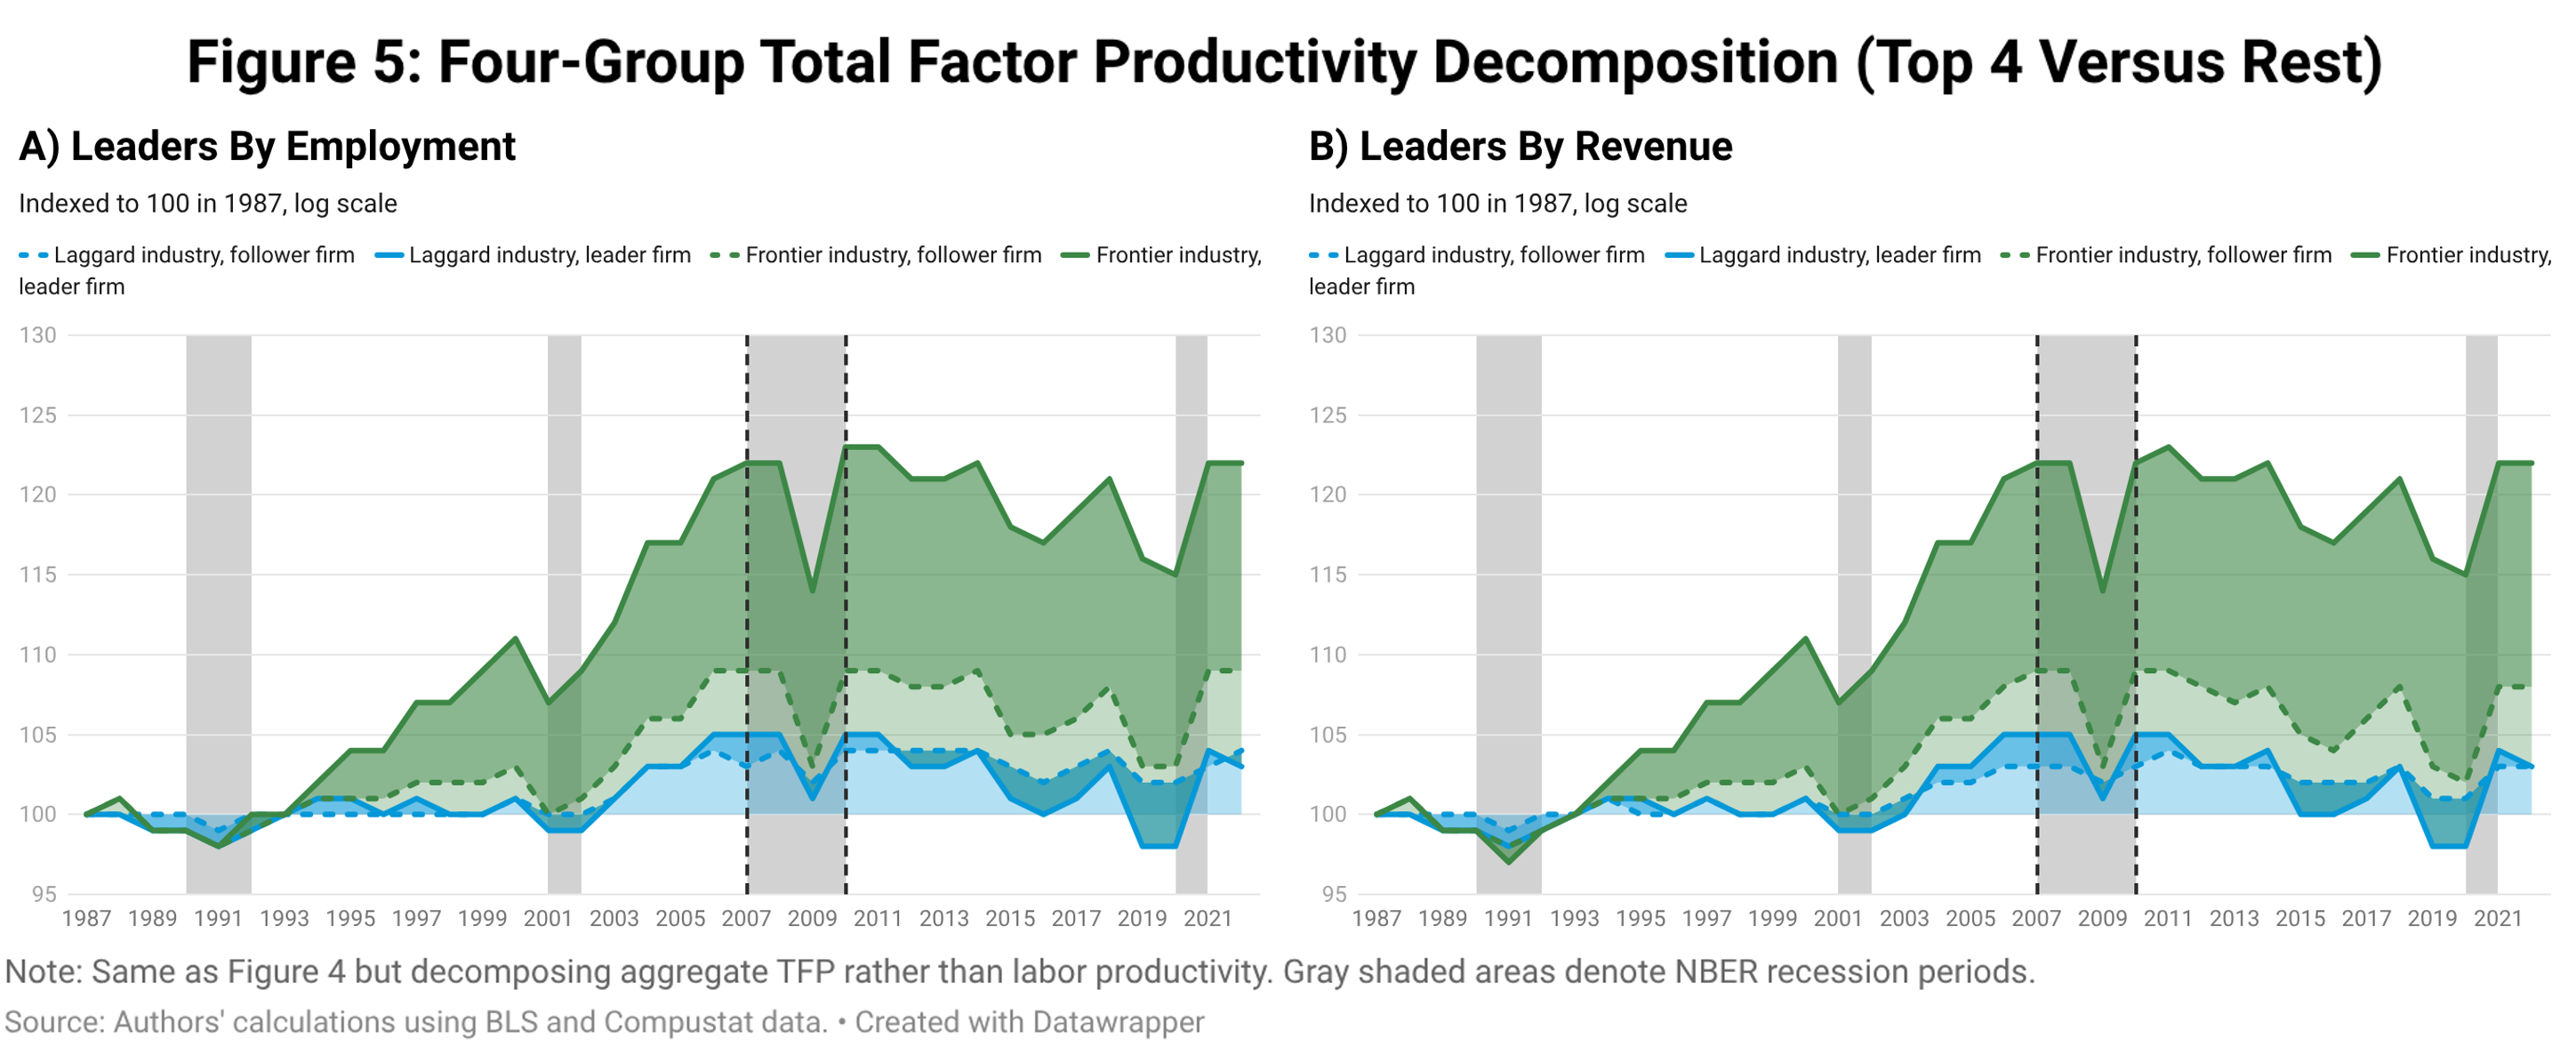
We decompose aggregate productivity growth using the log-additive approximation, which enables us to aggregate the separate contribution of each group ignoring the reallocation term. The method is consistent with the fact that aggregate log productivity growth is close to a weighted sum of group-level log productivity growth, , where is group ‘s share of aggregate hours. Each group’s contribution to aggregate growth is then its hours share times its own productivity growth. Slowdown shares, defined as each group’s share of the preto-post change in aggregate growth, sum to one by construction. This is only an approximation, but the small differences between initial-share productivity growth and evolving shares in Table 1 indicate it is unlikely to generate strong divergence. As a robustness check, we also report a level-additive (exact) decomposition in Appendix B.1. The qualitative conclusions are the same under both methods.
These results are robust to the choice of weighting scheme.2 The qualitative results are the same under all three schemes (see Appendix C.1, Figures 9–10). To assess the extensive margin directly, Appendix C.1 reports a Foster et al. (2001) decomposition that explicitly separates the contributions of entering, exiting, and continuing firms.
All groups contribute to the slowdown. Leader firms in the frontier industries account for about a quarter of the labour productivity slowdown and nearly half the TFP slowdown, but leaders and followers in laggard industries together account for roughly 70 per cent of the labour productivity slowdown (see Table 10 in Appendix C.2 for the full breakdown). We next focus on a split that has been discussed in the literature, that of looking at the most productive firms rather than the largest in a given industry.
Table 3 quantifies the contrast. Productivity-ranked leaders in the frontier industries still grew in the post-period, though at a substantially lower rate than in the pre-period. Productivity-ranked leaders in laggard industries experienced a relatively modest slowdown. Meanwhile, productivity ranked followers in laggard industries actually declined in the post-period. For TFP, the shift is even more striking: TFP-ranked leaders in laggard industries actually accelerated, offsetting the slowdown elsewhere. Follower firms account for 88 per cent of the labour productivity slowdown under this ranking (Table 11 in Appendix C.2).
The key reason productivity-ranked leaders matter less for the aggregate is mechanical: they command a small share of aggregate employment, so their continued growth has little weight in any decomposition. This finding is inconsistent with a “frontier exhaustion” story in which the most productive firms run out of ideas, and more consistent with broad-based mechanisms affecting the bulk of the firm distribution.
4. R&D and Research Productivity
The preceding section established that the productivity slowdown is generally broad-based. In Lashkari and Pearce (2026), we documented that R&D intensity rose even as productivity growth stalled, but we did not examine whether there has been a change in the innovation production function that maps R&D expenditures into productivity growth. In this section, we expand our analysis of the trends in R&D intensity and further study the relationship between R&D spending and productivity growth.
4.1 Trends in R&D Intensity
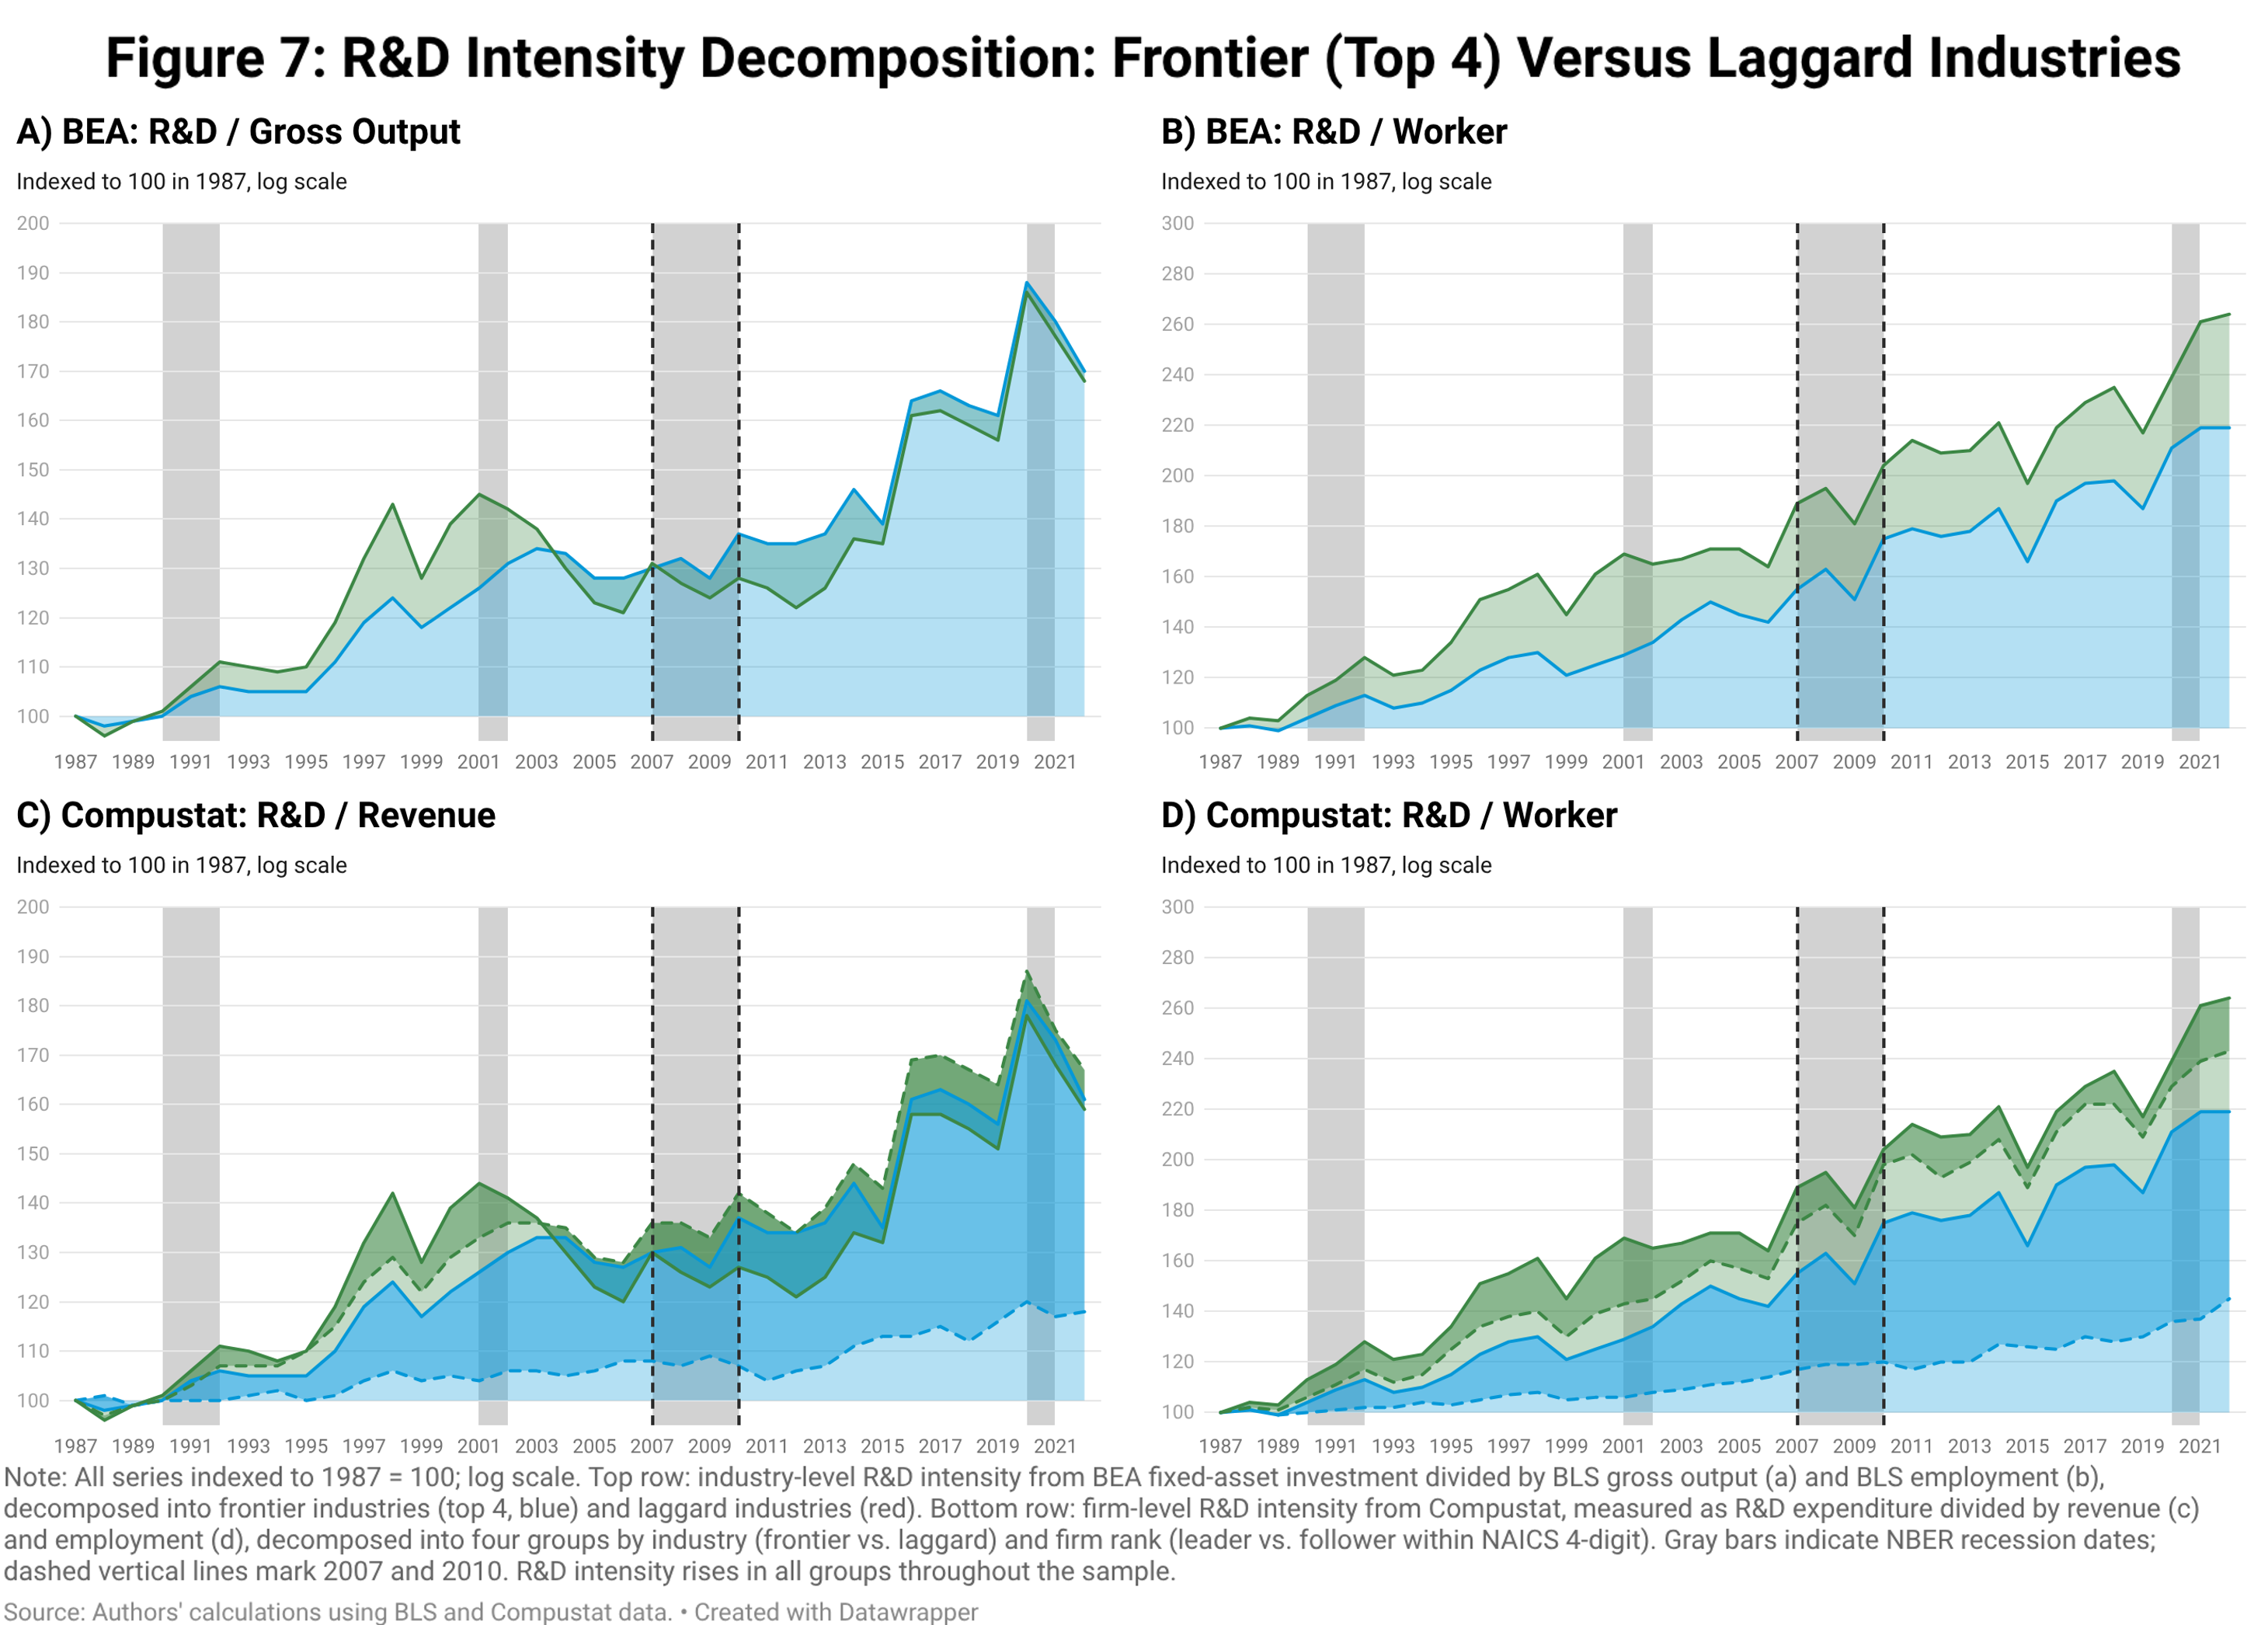
Figure 7 decomposes R&D intensity into contributions from frontier industries (top 4) and laggard industries, using both industry-level (BEA/BLS) and firm-level (Compustat) data. The top row measures R&D intensity at the industry level, dividing the BEA fixed-asset measure of R&D investment by BLS gross output (panel a) and BLS employment (panel b), with shaded areas distinguishing the contribution of frontier (green) and laggard (blue) industries. The bottom row applies the same decomposition at the firm level using Compustat data, further splitting each industry group into leader and follower firms within each NAICS 4-digit industry.
Several patterns emerge from Figure 7. First, R&D intensity rose broadly: the intensity in every group in every panel is higher in 2022 than in 1987, confirming that the productivity slowdown cannot be attributed to a decline in relative innovative effort. Second, the industry-level panels reveal that frontier industries consistently maintained higher R&D intensity than laggard industries, with the gap widening after 2000, particularly in R&D per worker (panel b). Third, the firm-level decomposition adds a within-industry dimension: in laggard industries, follower firms (light blue) account for most of the R&D intensity growth, while leader firms within those industries grew more modestly. In frontier industries, the pattern is reversed, with leader firms (dark green) driving the increase. Fourth, the R&D-to-gross-output ratio in panel (a) shows a pronounced dip around 2010 in frontier industries, mirroring the dot-com bust pattern from 2001, but recovers sharply afterward. Together these panels establish that the post-2007 productivity slowdown coincided with continued, and in most measures accelerating, growth in R&D effort across all groups. The natural question is therefore not whether firms stopped investing in innovation, but whether those investments became less effective at generating productivity gains.
4.2 Estimating the R&D–Productivity Connection
The preceding sections document two facts: the productivity slowdown is broad-based, and R&D intensity has risen even as productivity growth stalled. The natural question is whether these two facts are connected: has R&D become less effective at generating productivity growth? To answer this question, we need a framework that links R&D spending to subsequent productivity growth, controlling for the persistence of productivity itself. The dynamic panel literature provides such a framework (Arellano and Bond, 1991; Blundell and Bond, 1998).
We model the relationship as an R&D production function in which current R&D impacts the evolution of productivity in the next period following:
where indexes consecutive 4-year periods beginning with 1987–1990, is the mean productivity of unit over period (labour productivity LP or total factor productivity TFP), is the mean real R&D expenditure over the same period (deflated by skilled wages following Bloom et al. 2020), and is a unit fixed effect. The coefficient captures the elasticity of next-period productivity with respect to current R&D, controlling for the persistence of productivity (). A decline in from the pre-period to the full sample would indicate that a given increase in R&D spending translates into less productivity growth than it did before, consistent with the “ideas getting harder to find” hypothesis (Bloom et al., 2020).3
Estimating (2) by OLS with unit fixed effects would introduce Nickell bias: the within-group transformation mechanically correlates the lagged dependent variable with the error, biasing downward and potentially contaminating (we report OLS estimates in Appendix D for comparison). We address this issue using the system GMM estimator of Arellano and Bond (1991) and Blundell and Bond (1998). The idea is to estimate the model in two forms simultaneously. In first differences, the unit fixed effect drops out, and lagged levels of and serve as instruments for the differenced regressors. In levels, lagged differences of and serve as instruments, exploiting the assumption that these differences are uncorrelated with the fixed effect. Combining both sets of moment conditions yields more efficient estimates than either alone, particularly when the series are persistent, as productivity tends to be.
We estimate (2) at both the firm and the industry level. We note, however, that the industry level estimation has the advantage of capturing not only within-firm returns to R&D but also spillovers and business-stealing effects that operate across firms within an industry; a decline in at the industry level therefore reflects a weakening of the overall effect of R&D on industry productivity, inclusive of these channels.
At the industry level, the unit of observation is a 4-digit NAICS industry code, productivity is measured directly from BLS indices, and R&D expenditure is aggregated from Compustat to the 4-digit NAICS level. We consider three BLS productivity measures: TFP, real output per hour (the BLS’s preferred labour productivity measure), and real output per worker (more directly comparable to the firm-level measure). At the firm level, the unit of observation is a Compustat firm, and we estimate the model for both TFP, computed as a Solow residual following De Ridderet al. (2026), and labour productivity (deflated revenue per worker).
We estimate each specification under several variations to ensure robustness. We report unweighted and weighted estimates (using hours, employment, or nominal output weights at the industry level, and employment or revenue weights at the firm level), with and without time-period fixed effects, and under two instrument sets: all available lags (two or more) and only the first two available lags (two to three), the latter guarding against instrument proliferation (Roodman, 2009). For each specification, we report the Arellano and Bond (1991) tests for first- and second-order serial correlation in the differenced residuals (significant AR(1) is expected by construction, while significant AR(2) would signal misspecification) and the Sargan and Hansen tests for joint instrument validity.
We estimate the model over the full sample (1987–2022) and then re-estimate it for the pre-period alone (1987–2006, to match the 4-year period definitions). Comparing estimates of across the two samples is the central exercise: if R&D has become less effective, the pre-period estimate should exceed the full-sample estimate. We do not estimate the model separately for the post-period because we are left with a short panel in this period (only three non-overlapping 4-year periods after excluding 2008–2009), leaving the GMM moment conditions underpowered and leading to generally implausible parameter estimates with wide standard errors.
4.3 Estimation Results
Table 4 reports GMM estimates of the specification in Equation (2) at the industry level, comparing the pre-period to the full sample for total factor productivity. We report the specification for labour productivity in Appendix D. The results are similar across both specifications.
The R&D coefficient is larger in the pre-period in all specifications, declining by roughly one-third to one-half when the sample is extended to include the post-period. Results using output per worker are reported in Appendix D and are similar.
The diagnostic tests support the GMM specification. The AR(2) test, which is the key check on whether the moment conditions are valid, fails to reject the null hypothesis in all specifications for both labour productivity and TFP, indicating no evidence of second-order serial correlation in the differenced residuals. The Sargan test rejects the null hypothesis throughout, but this is expected: the Sargan statistic assumes homoskedastic errors and is known to over-reject in the presence of heteroskedasticity (Roodman, 2009). The Hansen test, which is robust to heteroskedasticity, passes in specifications that include time fixed effects, but rejects in some specifications without time fixed effects. Since the point estimates of are stable across specifications with and without time fixed effects, and the AR(2) test uniformly passes, we interpret the Hansen rejections as reflecting residual heteroskedasticity rather than fundamental instrument invalidity.
We present the full set of firm-level results in Appendix D. The firm-level results also exhibit patterns similar to the industry-level results, albeit somewhat less uniformly. The decline in is clear in specifications without time fixed effects (for instance, the unweighted labour productivity baseline drops from 0.103 to 0.066). When time fixed effects are included, they absorb common temporal variation and compress toward zero in both periods, so the pre-versus-full gap narrows. The firm estimates may be less reliable, because spillovers from R&D expenditures are significant and thus less responsive to firm-level decisions than industry-level changes.
We also estimate Equation (2) using OLS with unit and time-period fixed effects (see Appendix D). The OLS point estimates of are smaller than the GMM estimates, as expected given Nickell bias, but the pre-period estimates still exceed the full-sample estimates at the industry level across all specifications.
The decline in from the pre-period to the full sample is the central finding of this section. At the industry level, the pattern is pervasive: it holds across all three productivity measures, all weighting and instrument choices, with and without time fixed effects, and under both GMM and OLS. At the firm level, the decline is present in specifications without time fixed effects, but it is attenuated when time fixed effects absorb the common slowdown. Whether the decline reflects a structural shift in the knowledge production function or a compositional change (for instance, R&D shifting toward harder problems or toward activities that are not well captured by standard productivity measures) is a question these reduced-form estimates cannot resolve. What they do establish is that the relationship between R&D spending and subsequent productivity growth has weakened. Combined with the rising R&D intensity documented in Figure 7, this suggests that the manufacturing productivity slowdown reflects declining research productivity rather than reduced innovation effort.4
5. Conclusion
This article asks two questions about the U.S. manufacturing productivity slowdown. First, does it emerge broadly among large and small firms and among frontier and laggard industries? The answer is yes; the slowdown is evident across both groups of industries and across both leader and follower firms. This finding is robust across different weighting methods, different productivity measures (labour productivity and TFP), and multiple definitions of frontier/laggard industries or leader/follower firms. Firms selected in each period as most productive in their respective industries are an exception in that they do not exhibit a productivity slowdown, however, they only account for a small share of aggregate employment and revenue, limiting their role in any aggregate decomposition.
Second, does the slowdown reflect declining R&D effectiveness? R&D intensity rose across firms and industries even as productivity growth declined. System GMM estimates of an R&D production function at both the industry and firm levels show that the elasticity of productivity growth with respect to R&D expenditures is consistently weaker in the full sample than in the pre-period. These findings are consistent with the “ideas getting harder to find” hypothesis and suggest that the problem is not reduced innovation effort, but reflects a weakening link between R&D spending and productivity growth.
The key contrast in our findings is between two narratives. Leader-divergence theories (Andrews et al., 2019; Aghion et al., 2023) predict that the slowdown originates in follower firms, who fall further behind advancing technological leaders. Defining the frontier by productivity indeed yields a decomposition consistent with this story, but productivity-ranked leader firms are small and account for a negligible share of aggregate employment and revenue, implying that the divergence narrative does not explain the aggregate productivity slowdown. Similarly, rising-concentration accounts (Olmstead-Rumsey, 2022; Klenow et al., 2019) predict that the slowdown should be concentrated among smaller firms losing ground to dominant ones; our decomposition shows that both large and small firms slow down under size-based rankings. The broad-based pattern is instead more consistent with mechanisms that affect the entire firm distribution, as in the declining-dynamism framework of Akcigit and Ates (2023) or the “ideas getting harder to find” view of Bloom et al. (2020). Our R&D production function estimates provide direct evidence for the latter channel: the problem is not that firms stopped investing in research, but that a given dollar of R&D buys less productivity growth than it once did.
Two questions follow naturally. First, can manufacturing productivity bounce back? Our findings suggest that the declining effectiveness of R&D is a structural feature of the past two decades, however, the arrival of general-purpose technologies, such as artificial intelligence, has the potential to revitalize the frontier. Second, might the same patterns eventually hold for services, or will service-sector productivity continue to grow? This article cannot answer these questions, but it does provide an angle, linking Compustat firm-level data to industry-level aggregates, that can be applied to other sectors and time periods as data become available.
References
- Aghion, P., A. Bergeaud, T. Boppart, P.J. Klenow, and H. Li (2023) “A Theory of Falling Growth and Rising Rents,” Review of Economic Studies, Vol. 90, No. 6, pp. 2675–2702.
- Akcigit, U. and S.T. Ates (2023) “What Happened to US Business Dynamism?” Journal of Political Economy, Vol. 131, No. 8, pp. 2059–2124.
- Ando, Y., J.E. Bessen, and X. Wang (2025) “The Rising Returns to R&D: Ideas are not getting harder to find,” Boston Univ. School of Law Research Paper, No. 25-16.
- Andrews, D., C. Criscuolo, and P. Gal (2015) “Frontier Firms, Technology Diffusion and Public Policy: Micro Evidence from OECD Countries,” Productivity Working Papers 2, OECD.
- Andrews, D., C. Criscuolo, and P.N. Gal (2019) “The Best versus the Rest: Divergence across Firms during the Global Productivity Slowdown,” Technical Report, Centre for Economic Performance, LSE.
- Arellano, M. and S. Bond (1991) “Some Tests of Specification for Panel Data: Monte Carlo Evidence and an Application to Employment Equations,” The Review of Economic Studies, Vol. 58, No. 2, pp. 277–297.
- Atalay, E., A. Hortaçsu, N. Kimmel, and C. Syverson (2025) “Why Is Manufacturing Productivity Growth So Low?” Technical Report, National Bureau of Economic Research.
- Bloom, N., C.I. Jones, J. Van Reenen, and M. Webb (2020) “Are Ideas Getting Harder to Find?” American Economic Review, Vol. 110, No. 4, pp. 1104–1144.
- Blundell, R. and S. Bond (1998) “Initial Conditions and Moment Restrictions in Dynamic Panel Data Models,” Journal of Econometrics, Vol. 87, No. 1, pp. 115–143.
- Bureau of Labor Statistics (2025a) “Total Factor Productivity by Detailed Industries in Manufacturing, Air Transportation, and Line-Haul Railroads.” Available at: https://www.bls.gov/productivity/tables/. Accessed December 10, 2025.
- Bureau of Labor Statistics (2025b) “Total Factor Productivity by Major Industries.” Available at: https://www.bls.gov/productivity/tables/. Accessed December 10, 2025.
- Byrne, D.M., J.G. Fernald, and M.B. Reinsdorf (2016) “Does the United States Have a Productivity Slowdown or a Measurement Problem?” Brookings Papers on Economic Activity, pp. 109–182.
- De Ridder, M. (2024) “Market Power and Innovation in the Intangible Economy,” American Economic Review, Vol. 114, No. 1, pp. 199–251.
- De Ridder, M., B. Grassi, and G. Morzenti (2026) “The Hitchhiker’s Guide to Markup Estimation: Assessing Estimates from Financial Data,” Econometrica, Vol. 94, No. 1, pp. 137–168.
- Doraszelski, U. and J. Jaumandreu (2013) “R&D and Productivity: Estimating Endogenous Productivity,” Review of Economic Studies, Vol. 80, No. 4, pp. 1338–1383.
- Dyevre, A. (2024) “Public R&D Spillovers and Productivity Growth,” Working Paper, LSE Department of Economics.
- Eldridge, L.P. and S.G. Powers (2023) “Industry contributions to productivity growth in US manufacturing,” Monthly Labor Review.
- Fernald, J.G. (2015) “Productivity and Potential Output before, during, and after the Great Recession,” NBER Macroeconomics Annual, Vol. 29, No. 1, pp. 1–51.
- Fieldhouse, A.J. and K. Mertens (2023) “The Returns to Government R&D: Evidence from US Appropriations Shocks,” Working Paper 2305, Federal Reserve Bank of Dallas.
- Foster, L., J.C. Haltiwanger, and C.J. Krizan (2001) “Aggregate Productivity Growth: Lessons from Microeconomic Evidence,” in New Developments in Productivity Analysis, University of Chicago Press, pp. 303–372.
- Klenow, P.J., H. Li, and T. Naff (2019) “Is Rising Concentration Hampering Productivity Growth?” FRBSF Economic Letter, Vol. 28.
- Lashkari, D. and J. Pearce (2024) “The Mysterious Slowdown in US Manufacturing Productivity,” Liberty Street Economics.
- Lashkari, D. and J. Pearce (2026) “The Productivity Paradox in US Manufacturing: A Firm- and Industry-Level Perspective,” AEA Papers and Proceedings, forthcoming.
- Olmstead-Rumsey, J. (2022) “Market Concentration and the Productivity Slowdown,” Working Paper.
- Ottonello, P. and T. Winberry (2020) “Financial Heterogeneity and the Investment Channel of Monetary Policy,” Econometrica, Vol. 88, No. 6, pp. 2473–2502.
- Pearce, J. and L. Wu (2025) “Market Concentration and Aggregate Productivity: The Role of Demand,” Staff Reports 1159, Federal Reserve Bank of New York.
- Peters, B., M.J. Roberts, V.A. Vuong, and H. Fryges (2013) “Estimating Dynamic R&D Demand: An Analysis of Costs and Long-Run Benefits,” Working Paper 19374, National Bureau of Economic Research.
- Roodman, D. (2009) “How to Do xtabond2: An Introduction to Difference and System GMM in Stata,” Stata Journal, Vol. 9, No. 1, pp. 86–136.
- Sharpe, A. and R. Chittoor (2025) “The Stylized Facts of the US Manufacturing Productivity Slowdown,” Working Paper.
- Standard & Poor’s (2025) “Compustat North America.” Distributed by Wharton Research Data Services. Accessed December 10, 2025.
- Syverson, C. (2017) “Challenges to Mismeasurement Explanations for the US Productivity Slowdown,” Journal of Economic Perspectives, Vol. 31, No. 2, pp. 165–186.
- U.S. Bureau of Economic Analysis (2025) “Detailed Data for Fixed Assets and Consumer Durable Goods: Nonresidential Detailed Investment — Investment.” Available at: https://apps.bea.gov/iTable.
- U.S. Census Bureau (2025) “Historical Income Tables: People, Table P-18: Educational Attainment — People 25 Years Old and Over by Mean Income and Sex.” Available at: https://www.census.gov/data/tables/time-series/demo/income-poverty/historical-income-people.html. Accessed December 10, 2025.
Footnotes
- More details on the output measures are discussed in Eldridge and Powers (2023), who note the advantages of using sectoral output as the proper TFP measure.
- Our method restricts the sample to continuing firms, since entrants and exiters lack the lagged or current shares needed to form the average. Our restriction implicitly attributes to entrants and exiters the same productivity growth as the continuing-firm average. If entry and exit patterns shifted between the pre- and post-periods, the period-average decomposition would miss this channel. Under current-period weights, entrants appear with their current share but contribute zero within-firm growth; the between term then picks up some entry/exit composition effects but conflates them with reallocation among incumbents. Whereas in Lashkari and Pearce (2026) we use current-period weights as the baseline, here we switch to period-average weights. See Appendix C.1 for further discussion.
- The magnitude of our industry-level elasticities is broadly consistent with Doraszelski and Jaumandreu (2013), who estimate firm-level R&D elasticities below 0.05 using Spanish manufacturing data. Other studies report somewhat different magnitudes depending on the time period, country, and whether they focus on within-firm returns or broader spillover channels (Peters et al., 2013; Fieldhouse and Mertens, 2023; Dyevre, 2024).
- Alternatively, Ando et al. (2025) find that ideas are not getting harder to find. Higher rates of knowledge obsolescence or lower spillovers would be consistent with this story and declining productivity growth.