

Abstract
Understanding health care productivity is critical, as the sector accounts for about 17 per cent of U.S. gross domestic product. However, official statistics likely understate productivity growth by failing to capture improvements in medical technology and treatment quality. The Health Care Satellite Account (HCSA), developed by the U.S. Bureau of Economic Analysis, addresses this gap by measuring spending by medical condition, enabling more meaningful output measurement. We present a simple framework that combines the HCSA with population health data to adjust prices and output for quality improvements. Output is defined as marginal health gains rather than service counts, consistent with prior recommendations. This approach approximates more comprehensive methods while remaining tractable. Our results suggest substantial quality-adjusted productivity growth that is largely masked in official statistics, implying a downward bias of about 1.5 percentage points per year, with a range from 0 to over 5 percentage points. Productivity gains may be larger in other high-income countries, where life expectancy has increased more and spending has grown more slowly.
1. Introduction
U.S. medical care spending has grown from 5 per cent of Gross Domestic Product (GDP) in the 1960s to 17 per cent in 2023.1 Because health care is such a large share of the economy, measures of health care inflation, output, and productivity can have meaningful effects on the corresponding economy-wide measures, which are used by policymakers setting budgets, businesses making investment decisions, and other users of official statistics, including those used in monetary policy decisions. While U.S. government statistical agencies apply quality-adjustment methods to measure prices and output in other high-tech sectors of the economy, such as computers and smartphones, there is no comparable quality adjustment for the health sector. However, since the 1960s, life expectancy has increased by about nine years, much of which is thought to be driven by spending on innovations that improve health outcomes.2 For example, more effective treatments for cardiovascular conditions, cancers, hepatitis C, HIV, and rheumatoid arthritis have extended life expectancy and improved quality of life around the world. If medical care is driving these changes in life expectancy, then many prominent papers argue that this spending is “worth it” and productivity is increasing rapidly, at least in some circumstances (Cutler and McClellan, 2001; Cutler et al., 1998; Hall and Jones (2007); Murphy and Topel, 2006). However, the unadjusted measures for health care imply weak or negative productivity growth for the past several decades. According to U.S. Bureau of Labor Statistics (BLS), annual total factor productivity growth from 1990 to 2019 for health care and social assistance (NAICS 62) has fallen by 0.6 per cent per year.3
Currently, official statistics on health care track spending across broad service categories like hospitals, physicians, or prescription drugs, which provide limited insights into many key developments in the health sector. Namely, these aggregate figures obscure wide variation in treatments as individual diseases are associated with distinct treatment technologies. For instance, while treatments for the common cold have changed little over the past century, therapies for other conditions, such as cancers, cystic fibrosis, and multiple sclerosis, would not be recognizable from three decades ago. Grouping such diverse conditions and treatments into the same category is akin to combining the agricultural and high-tech sectors of the economy — it conceals fundamental shifts and innovations. This service-based framework has two main shortcomings. First, it fails to capture substitution patterns across medical industries in the treatment of particular conditions. For instance, shifting from costly inpatient hospital care to outpatient visits can substantially reduce treatment costs, yet such changes are not reflected in official statistics (Aizcorbe and Nestoriak, 2011). Second, it ignores the unique technologies associated with each condition, limiting the potential to make meaningful quality adjustments.
This limitation of official statistics led to the development of the Health Care Satellite Account (HCSA) at the Bureau of Economic Analysis (BEA). Unlike traditional statistics that primarily track health care inputs (e.g., hospitals, physician offices, and prescription drugs), the HCSA redefines output to be the treatment of a condition, essentially treating each condition as its own industry (National Research Council, 2011; Cutler et al., 2022). Under traditional accounts, output rises with service volume; but under the HCSA, output rises with number of patients treated. The account tracks spending, the price of treatment, and output for about 260 medical conditions (Dunn et al., 2015). This framework appropriately treats hospitals, physicians, and prescription drugs as inputs into the treatment of a disease, rather than outputs, and allows for detailed insights into the diverse patterns of health care spending across different conditions. Indeed, health economists and measurement experts have long advocated for measuring the health sector output by the treatment of a condition for these reasons (Berndt et al., 2000; National Research Council, 2011). However, a current limitation of the HCSA is that it does not account for quality changes brought about by improved technology.
In this article, we first derive key measurement concepts, such as quality-adjusted prices, output, and productivity. We define nominal output as expenditures on medical treatments, and apply a price index derived by Cutler et al. (1998) and Fisher and Shell (1972) to measure real output. This utility-based price index captures the compensating variation necessary for patients to maintain the same level of utility across periods. Consistent with Cutler et al. (1998) and Cutler et al. (2022), the utility derived from medical care includes benefits (e.g., improved health due to treatment) and costs of treatment. While the HCSA is consistent with United Nations System of National Accounts (SNA) 2025 goal of creating extended accounts that offer more detailed insights into the health care sector, the approach we take in this article deviates from the standard SNA methodology and is closer in spirit to the GDP-B framework outlined in Brynjolfsson et al. (2019), which aims to better capture the full benefits of economic production. More specifically, the work more closely follows the recommendations of National Research Council (2011) and Sheiner and Cutler (2024) that outline methodologies for improving measurement in the health care sector.
We then demonstrate how to construct approximate quality-adjusted estimates of prices, output, and productivity using publicly available data. Our quality-adjusted price index is constructed using estimates of the price of treatment from the HCSA, per capita health expenditures from the National Health Expenditure Accounts (NHEA), and life expectancy estimates from the National Center for Health Statistics (NCHS). In our analyses, we use aggregate (i.e., across all conditions) life expectancy improvements to quality adjust our aggregate price and output measures. The life-expectancy measure may reflect changes in population health due to non-medical factors.4 To account for non-medical determinants of life expectancy, we incorporate information from Cutler et al. (2022), which develops a methodology for disentangling changes in health due to medical care from other factors.
This article builds on a much broader agenda to improve the measurement of health and health care (National Research Council, 2011; Sheiner and Malinovskaya, 2016), which includes numerous contributions in health-related literatures.5 More specifically, this article builds on work by Cutler et al. (2022) and Weaver et al. (2022) who have developed in-depth methodologies which capture disease-specific changes in quality. However, these studies require complex methodologies and very detailed data. Our contribution is to demonstrate an approximation to these studies with readily available data sources to provide top-line analysis. In theory, this provides a starting point for more timely and transparent estimates, which is an important goal of statistical agencies. Furthermore, we extend Cutler et al. (2022), which focuses on the aged 65 and over population (due to data availability), to the entire population. We find that measuring the entire age distribution makes a large difference in our productivity estimates. Much of the medical care we consume at earlier ages extends or improves life beyond the age of 65. In productivity terms, many of the health production function inputs occur before 65, while many of the outputs (health improvements) accrue to those older than 65. Hence, our results suggest that a productivity measure should capture inputs made throughout the life-cycle.
Our central estimates show that quality-adjusted prices fall by about 1.3 percentage points per year relative to economy-wide inflation over the period from 2000 to 2019. This is about 1.7 percentage points below the official index for the sector (the Personal Consumption Expenditure (PCE) health price index), indicating output and productivity are understated by a similar amount.6 Adjusting the baseline estimate of productivity from BLS to account for the improvement in quality, we estimate productivity growth of about 1.7 per cent per year, which is substantially higher than the official estimate of 0.16 per cent per year for health care and social assistance sector.7 The estimate is sensitive to the value placed on a healthy year of life, as well as assumptions about how much of the change in health is due to medical care versus other factors. Over a wide range of assumptions, our estimates of the quality-adjusted price index range from 0.2 per cent to -7.6 per cent per year, relative to economy-wide inflation. However, the range of spending per healthy life year saved is between 70,000 and115,000, suggesting sizable financial cost for improved health, which should be of key interest to policymakers that must consider both limited budgets and the opportunity cost of these expenditures. Although it is important to note that the higher cost is arguably “worth it” as these amounts are substantially below the typical value placed on a healthy life year, which is typically over $150,000 (Kearsley, 2024).
The approximation presented here provides a top-line estimate which relies on more aggregate assumptions, providing an independent range of estimates to better understand the productivity of the sector. If we apply our estimates to the over-65 population, we find productivity growth estimates that are much larger than our baseline findings. The likely reason is that the share of health spending for those under 65 is relatively large compared to the improvement in health outcomes they experience. Those under 65 account for 53 per cent of the lifetime health care spending. Meanwhile, most of the health gains in life expectancy go to those 65 and over. Over the period we study, life expectancy increased 1.7 years for the 65 and over population, and 2.0 years for the full population, only an additional 0.3 years. One interpretation is that medical care spending under 65 is less productive. However, medical care spending under 65 is often an investment to lengthen one’s life or improve life after 65, as in the seminal paper by Grossman (1972). For this reason, one would want to measure health care spending across the entire age distribution to measure productivity. While this is a small extension, it makes a meaningful impact in our price index and productivity estimates: our price index estimate grows -2.1 per cent per year when using only the 65 and over population versus -0.7 per cent annually when measuring the entire age distribution.8
As an alternative to using population health outcomes, Eggleston et al. (2020), Dunn et al. (2022), Cutler et al. (2022), and Dunn et al. (2024) use measures of clinical effectiveness of technologies from the medical literature to measure quality changes. Additional evidence based on acute health conditions, where the role of medical technology is more clear, also provides additional supporting evidence of the productivity change (see Cutler et al., 1998; Romley et al., 2020; and Dauda et al., 2022). We find that these alternative approaches are generally consistent with the approximation presented in this article.
The estimates presented in this article are useful to better gauge the potential bounds of mismeasurement in aggregate statistics, as well as understanding the costs of health improvement in the aggregate. However, these aggregate estimates do not reveal heterogeneous productivity differences in health care spending across populations or conditions, limiting their usefulness for health care management decisions.
While significant progress has been made in this literature, there are several important caveats. The first is that this measure of productivity is based on utility theory and consumer welfare, and is distinct from methods applied elsewhere in the accounts (see Dynan and Sheiner, 2018). The focus on welfare measurement more closely aligns with the GDP-B approach of Brynjolfsson et al. (2019). This approach departs somewhat from the SNA 2025 that focuses on the measurement of outputs from economic activity rather than outcomes. However, the distinction between output and outcomes blurs in the health sector as the quality-adjusted price and output depend on the expected outcome of treatments, although not (as a conceptual matter) outcomes due to non-medical factors. This distinction is important as policy implications for changes in outcome due to medical care are different for changes in outcomes due to changes in population health. A second caveat is related to the interpretation of the estimates. Evidence that productivity is improving does not necessarily imply that health spending is optimal from a welfare, budgetary, or incentive standpoint. Although the benefits appear to exceed the cost in our baseline estimates, this does not preclude the existence of alternative scenarios — such as lower spending or better health outcomes — that might generate even greater productivity gains. Additionally, policymakers may interpret these estimates differently based on their policy objectives. Some may focus primarily on short-term consumer welfare, while others might prioritize ensuring adequate incentives for firms to invest and innovate that could potentially lead to larger long-run welfare gains. Despite potentially different interpretations, providing such statistics equips policymakers with crucial information to make more informed decisions.
2. Health Care Satellite Account
Each medical condition warrants distinct treatments, underscoring the value of condition-specific data in the HCSA. The HCSA estimates begin with nationally representative survey data from the Medical Expenditure Panel Survey (MEPS), which collects detailed information on about 30,000 individuals per year, their treatment expenditures, medical conditions, and associated expenditures across all service types. While the sample size may seem large, it is actually relatively small when analyzing trends for specific conditions (see Dunn et al., 2015). For this reason, the HCSA combines MEPS data with large claims databases. For the privately insured population, BEA uses the Merative MarketScan Research Databases claims, which is a convenience sample of the privately insured population. For Medicare beneficiaries, the HCSA uses claims data from the Center for Medicare and Medicaid Services (CMS). For the remaining population, including Medicaid enrollees and the uninsured, the HCSA uses MEPS data. Each claims data source adds millions of enrollees and billions of claims to the estimates, and population weights are applied to maintain the representativeness of the estimates. The large sample size is necessary for capturing patterns for conditions that are costly but relatively rare in the population, such as cystic fibrosis.
In addition to tracking nominal spending by condition, the HCSA includes a price index that measures the cost of treating a condition. It is measured as the total expenditures to treat a patient over one year. For example, for heart disease, the treatment price for a patient includes all care received in a year, such as doctors’ visits, labs, scans, hospital visits, and prescription drugs. Figure 1 shows trends in treatment costs for select conditions, deflated by the aggregate PCE deflator. The figure shows that the price of treating medical conditions can vary substantially over time. For example, treatment costs for rheumatoid arthritis, hepatitis, and cystic fibrosis surged as new, higher-quality drugs entered the market, followed by a sharp decline in hepatitis spending around 2015 due to increased competition among innovative drugs. In contrast, spending patterns for diabetes and heart disease were relatively flat and actually declined relative to economy-wide inflation.9
Understanding spending patterns by condition is useful for many questions that have important policy implications. What conditions account for the greatest share of spending? What conditions are driving expenditure growth, and which are slowing it down? How do these changes relate to regulations, innovations, population health, or other trends in the market? Another important use of this information is to improve measures of output and productivity to better understand the value of medical care spending. Condition-specific data make it easier to improve measures of output and productivity, as treatment technologies — and their associated costs and quality improvement — are often unique to each condition. This, in turn, allows for a more accurate assessment of the value of medical care spending. In addition, the HCSA more appropriately handles inefficient spending, relative to traditional methods. The traditional methods count output as growing as more services are provided, so inefficient spending leads to higher output. The HCSA output grows only with the number of patients, so an increase in inefficient spending per patient leads to a higher price of treatment and does not increase output.
One advantage of the condition-based price measure over traditional service-based price index measures is that it redefines the output to be the treatment of a condition, which better handles substitution patterns across different types of inputs, as highlighted by Aizcorbe and Nestoriak (2012).10 Aizcorbe and Nestoriak (2012) demonstrate that shifts could lead to cost savings, leading condition-based price indexes to grow more slowly than traditional indexes (e.g., shift from expensive inpatient services to outpatient services).11
Alternatively, if more expensive new technologies are used in treatment, this could lead the condition-based index to rise more quickly than the traditional PCE health price measure. Specifically, if an expensive new treatment enters the market in year 2, it will not be added to the PCE index in tracking price changes from year 1 to year 2, as it tracks a fixed basket of goods and services and excludes the new treatment. In contrast, the HCSA will increase in year 2 when the new treatment replaces older, cheaper treatments. If the new and higher price technology is also of higher quality, both indexes will be biased, but the HCSA may appear to have a larger bias, as the new technology leads to a bigger increase in the index, relative to the PCE health measure.
Theoretically, either effect (e.g., shifting services to cheaper settings, or new innovative treatments raising costs) could dominate, but as shown in Figure 2, the condition-based price index tends to grow faster than the traditional PCE health price index, highlighting the role of technology likely driving up the cost of treatment. In fact, the condition-based price index grows faster in many cases because of the adoption of newer and costlier technologies, such as for the treatment of several of the conditions shown in Figure 1. At the same time, micro evidence shows shifts toward higher quality treatments. Dunn et al. (2024) examine innovations for 13 health conditions and show that there is a tendency for consumers to gravitate toward higher quality new treatments, even if those treatments are substantially more expensive. Chandra et al. (2016) show that patients gravitate toward higher quality hospitals over time, even for acute health conditions. This evidence highlights the need to properly quality adjust condition-based price indexes.
3. Cross-Country Differences
This article focuses on the U.S. experience, but there is broad international interest in this topic due to both the importance of health and the growing share of government budgets across economies. Cross-country comparisons further highlight the link between economic measures and health outcomes. Deaton and Schreyer (2022) show a strong positive correlation between national accounts aggregates — particularly actual individual consumption — and life expectancy. While this relationship is evident, what remains largely unmeasured is how such health outcomes connect to the output and productivity of the health care sector, despite their clear significance for both economic performance and overall well-being. A key challenge is isolating the contribution of medical care from broader non-medical determinants of health (Sharpe et al., 2007; Schreyer, 2012; National Research Council, 2011; and Sheiner and Cutler, 2024).
One fact that stands out from these comparisons is that the U.S. spends substantially more on health care than most other economies, yet health outcomes measured by life expectancy and some other metrics are substantially worse (Peter G. Peterson Foundation, 2020). There are a variety of theories regarding what drives these differences, including administrative costs, pricing, adoption of high cost technologies, heterogeneity in treatment across the population, and differences in underlying population health (Garber and Skinner, 2008; Cutler and Ly, 2011; Chandra and Skinner, 2012; and Einav and Finkelstein, 2023). While aggregate statistics suggest that the U.S. health sector is less efficient, several studies suggest that higher obesity rates may contribute substantially to lower life expectancy, complicating these comparisons (Preston and Stokes, 2011; and Mokdad et al., 2024). To compare the productivity of health systems over time or across countries, it is necessary to account for the differences in population health affecting both outcomes and spending to better isolate the effects of the health care sector on health outcomes and spending. In this article, we focus on the productivity in the United States over time.
4. Literature
This section highlights key insights relevant to measuring productivity in the health sector. For a more comprehensive review of the literature, see Hall (2017), Sheiner and Malinovskaya (2016), and Sheiner and Cutler (2024).
This article focuses on a utility-based measure of productivity, where we show the change in output per treatment depends on improved health. Alternative methods tend to greatly understate the value of health improvements, as highlighted in several recent papers (Sheiner and Malinovskaya, 2016; Dauda et al., 2022; and Dunn et al., 2022). Additionally, hedonics used in other industries, such as computers or smartphones, are poorly suited to the health care sector, where there are numerous market distortions and consumers rarely face the marginal cost of treatment (Berndt et al., 2000).
There is broad evidence that the quality of treatments is improving over time, leading to improved health outcomes. This evidence comes from studies using population health to measure quality, analysis based on the clinical literature, and studies examining acute health conditions (see Sheiner and Cutler, 2024, for a recent overview). Outside of the United States, recent evidence from Park et al. (2025) shows large quality improvements in South Korea, likely attributable to improvements in the health sector. Eggleston et al. (2020) show quality-adjusted prices falling for diabetes care across several countries. While many papers in this literature focus on specific health conditions, the goal of this article is to estimate an aggregate quality-adjusted price index for the United States.
The methodology used to derive a quality-adjusted price and productivity relies on the dollar value placed on improved health (see Viscusi, 2020, for a review). Recent estimates of a value of a life in the U.S. range from $6 million to $20 million (Kearsley, 2024), but the exact magnitude is important for assessing the productivity gains in the sector. Using the dollar value of health from Kearsley (2024), the value for a year of health is $150,000 or more.12 Our analysis follows Cutler et al. (2022) and uses a value of $100,000 for comparability. However, given the uncertainty and higher range implied by the literature, we also provide estimates using $150,000 and $250,000 per statistical life year.
5. Measuring Output and Productivity in the Health Care Sector
Understanding both the benefits and the costs of treatment is fundamental for measuring the productivity of the health sector, but numerous distortions in health care markets complicate standard approaches for measuring quality change. Seminal work by Cutler et al. (1998) addresses this issue by developing a framework based on utility theory that is robust to market distortions in the health care sector. This section presents basic formulas for price, output, and productivity derived from this utility-based framework.
5.1 Quality-Adjusted Price Index
Following Cutler et al. (1998), Sheiner and Malinovskaya (2016), and Dauda et al. (2022), let be the quality-adjusted price index for a condition from time period to . We apply a Laspeyres-type price index that uses a compensating variation welfare formula to adjust for quality.13 The quality-adjusted price index measures the growth in treatment expenditure from period that would be necessary to maintain the same level of utility in period , holding technology constant. Let be the lifetime expenditure for treatment of condition at time .14 Let be the incremental amount of health produced from treatment at time for disease . is often measured in terms of quality-adjusted life years (QALYs) that account for both the number of years alive and the quality of those years, where one QALY is one year of life in perfect health.15
Importantly, is not the actual health outcome, but the amount of health due to treatment and not other factors (e.g., diet or exercise). Both and are typically risk-adjusted to account for the age and health conditions of the patient, so that changes in expenditures and health outcomes are the changes from medical care, and not changes from other factors.
In order to quality adjust the price of treatment, a value is needed to convert units of health into dollars. Typically, researchers apply measures from external studies that derive estimates of the value of a statistical life year, as discussed previously. Here we let the dollar value of a statistical life year be represented as (Value of a Quality-Adjusted Life Year), and we consider the range from $100,000 to $250,000. The change in quality of treatment is then , so the dollar value of the change is: .
We follow Dauda et al. (2022) and Sheiner and Malinovskaya (2016) to compute a quality-adjusted price for condition at time . The price index is an index of the growth in price from the base period 0 to the end of our sample . Intuitively, the quality-adjusted price asks how much spending in period 0 would be needed to deliver the same utility as treatment in period . In order to hold technology constant, the quality improvements must be subtracted from the unadjusted treatment price, , in period .
The second row of the index shows that without any change in the quality of treatment, the price index measure would be a measure of the unadjusted price of treatment, , which is the price index in the HCSA. Quality improvements lead to reductions in the quality-adjusted price of treatment through the adjustment term in the numerator, . The derivation is in the appendix, but this formulation is intuitive.
Consider the example of the price change from the introduction of the drug Sovaldi in 2014 used to treat Hepatitis C discussed in Dunn et al. (2022). They consider the price change compared to the prior drug interferon. Based on cost-effectiveness studies, the price of Sovaldi was $105,488, while the price of interferon was $81,211. The Quality-Adjusted-Life-Years (QALYs) from treatment is 9.4 for Sovaldi and 8.28 for interferon. As an illustrative example, they place a relatively low value on the QALY of just $50,000. Based on these estimates and the utility-based price index formula, the price index falls by 39 per cent.16 Intuitively, the average person is receiving $56,000 = $50,000*(9.4-8.28) of value for the health they are purchasing, at an incremental cost of $24,000 = $105,000 – $81,000, hence quality adjusted prices are falling.17
One seemingly intuitive alternative price adjustment is to scale the price by the quality change, for example, . Intuitively, one can view this as the change in the price of a QALY. However, as pointed out in a number of recent papers (Sheiner, 2016; Dunn et al., 2022; and Dauda et al., 2022), scaling price changes by the growth in quality of treatment does not account for the value of a QALY.
Here is a stylized example to highlight this. Suppose an individual with high cholesterol in 1980 has a baseline life expectancy of 10 years and their cholesterol medication cost $1,000. By 2015, statins have entered the market and gone off patent. Suppose that the same individual would now have 15 years of life expectancy, and their statins cost $2,000. This index suggests that quality adjusted prices have risen by 33 per cent , placing an implicit value of the health gain of around $670.18 However, most economists would argue that a 5-year increase in life expectancy is worth more than several hundred dollars. Our measure differs because it places an explicit value on a year of life, while the price-per-QALY approach is orthogonal to changes in the value of a life year, as that term cancels out of the ratio .
Others in the literature have pointed out the differences between these two intuitive ways of quality adjusting health spending (Sheiner, 2016; Dunn et al., 2022; and Dauda et al., 2022). Specifically, Sheiner and Malinovskaya (2016) points out that if one assumes that the price-per-QALY is roughly the VSLY, then our indexes are the same.19 While this type of assumption is valid in many contexts, it is often violated in health care markets. Some very cheap technologies, like generic drugs, can provide a lot of health benefits at very low costs. But, in many cases, it is not possible to buy more health, even with very high levels of expenditure, due to technological constraints.
5.2 Growth in Real Output
Real output per case (i.e., per patient), , is obtained by dividing spending per case by the quality-adjusted price index.20 Using equation 1, we have . Let the number of cases be in period and in period 0. Total real output in period is and the real output in the base period is . Therefore, the index of quality-adjusted total real output growth, reflecting real personal health care consumption, is:
The index measure of real output growth is an increasing function of the health gained from the treatment: that is scaled to a dollar value, times the growth in the number of cases. If the quality does not change, then the output growth does not depend on the amount spent on treatment, but only the number of treatments. If quality does change, then an adjustment is needed to convert output per case in the base period to the output per case in period . It is worth emphasizing that this is a stark difference from more traditional output measures. Holding the number of cases constant, then the quality-adjusted output measure only increases when health from treatment improves, while traditional measures increase as more goods and services are provided (e.g., doctors visits or prescription drugs).
The growth in output is not proportional to the growth in health. It depends on the increase in health relative to the amount spent on the treatment.21 For countries that do not measure output growth by deflating expenditures, the adjustment could be applied directly to an output per case growth measure in equation 3.22
5.3 Productivity
The productivity change is determined by the growth in real output relative to the growth in inputs. Let be the nominal (input) cost per case, then to obtain the real cost per case, , we divide by an input price index. The cost includes the associated cost of inputs (e.g., capital, labour, and materials), and may differ from if more output can be produced with the same level of costs. The index of real input growth is then . Productivity growth is the growth in real output divided by the growth in real input:
Inserting the formula for growth in real output and growth in costs we have:
Equation 4 shows that the quality adjustment enters through the output price index, so one way to adjust the official measure of productivity is to apply an adjustment to the output price index (see Dunn et al., 2022), which is the approach we take in the empirical section below. More precisely, we are essentially changing the deflator applied to output by multiplying the official growth in real output by the ratio of the corresponding official deflator, divided by the quality-adjusted price index.
6. Empirical Evidence
6.1 Estimates Based on the Health Care Satellite Account
This section reports estimates of the quality-adjusted price index and productivity index, based on the formulas developed in the previous section. To avoid distortions from COVID-19, we focus our estimates on the period 2000–2019.
We present an aggregate quality-adjusted price index that is a simplified version of Cutler et al. (2022). At an aggregate level, the analysis can be simplified as it avoids explicit allocation across conditions, where it may be challenging to match spending to health outcomes. For instance, suppose a patient dies with renal failure and heart disease, two serious conditions that often appear together. In this case, it is challenging to attribute this change in health across these conditions, as both likely contributed to the death. A similar allocation is necessary for spending across the two conditions. To address this issue, Cutler et al. (2022) use a complex propensity score methodology that requires detailed micro data on conditions and health outcomes. However, we can observe changes in aggregate health, which avoids the complexities of attribution, and is sufficient for aggregate measures of productivity.
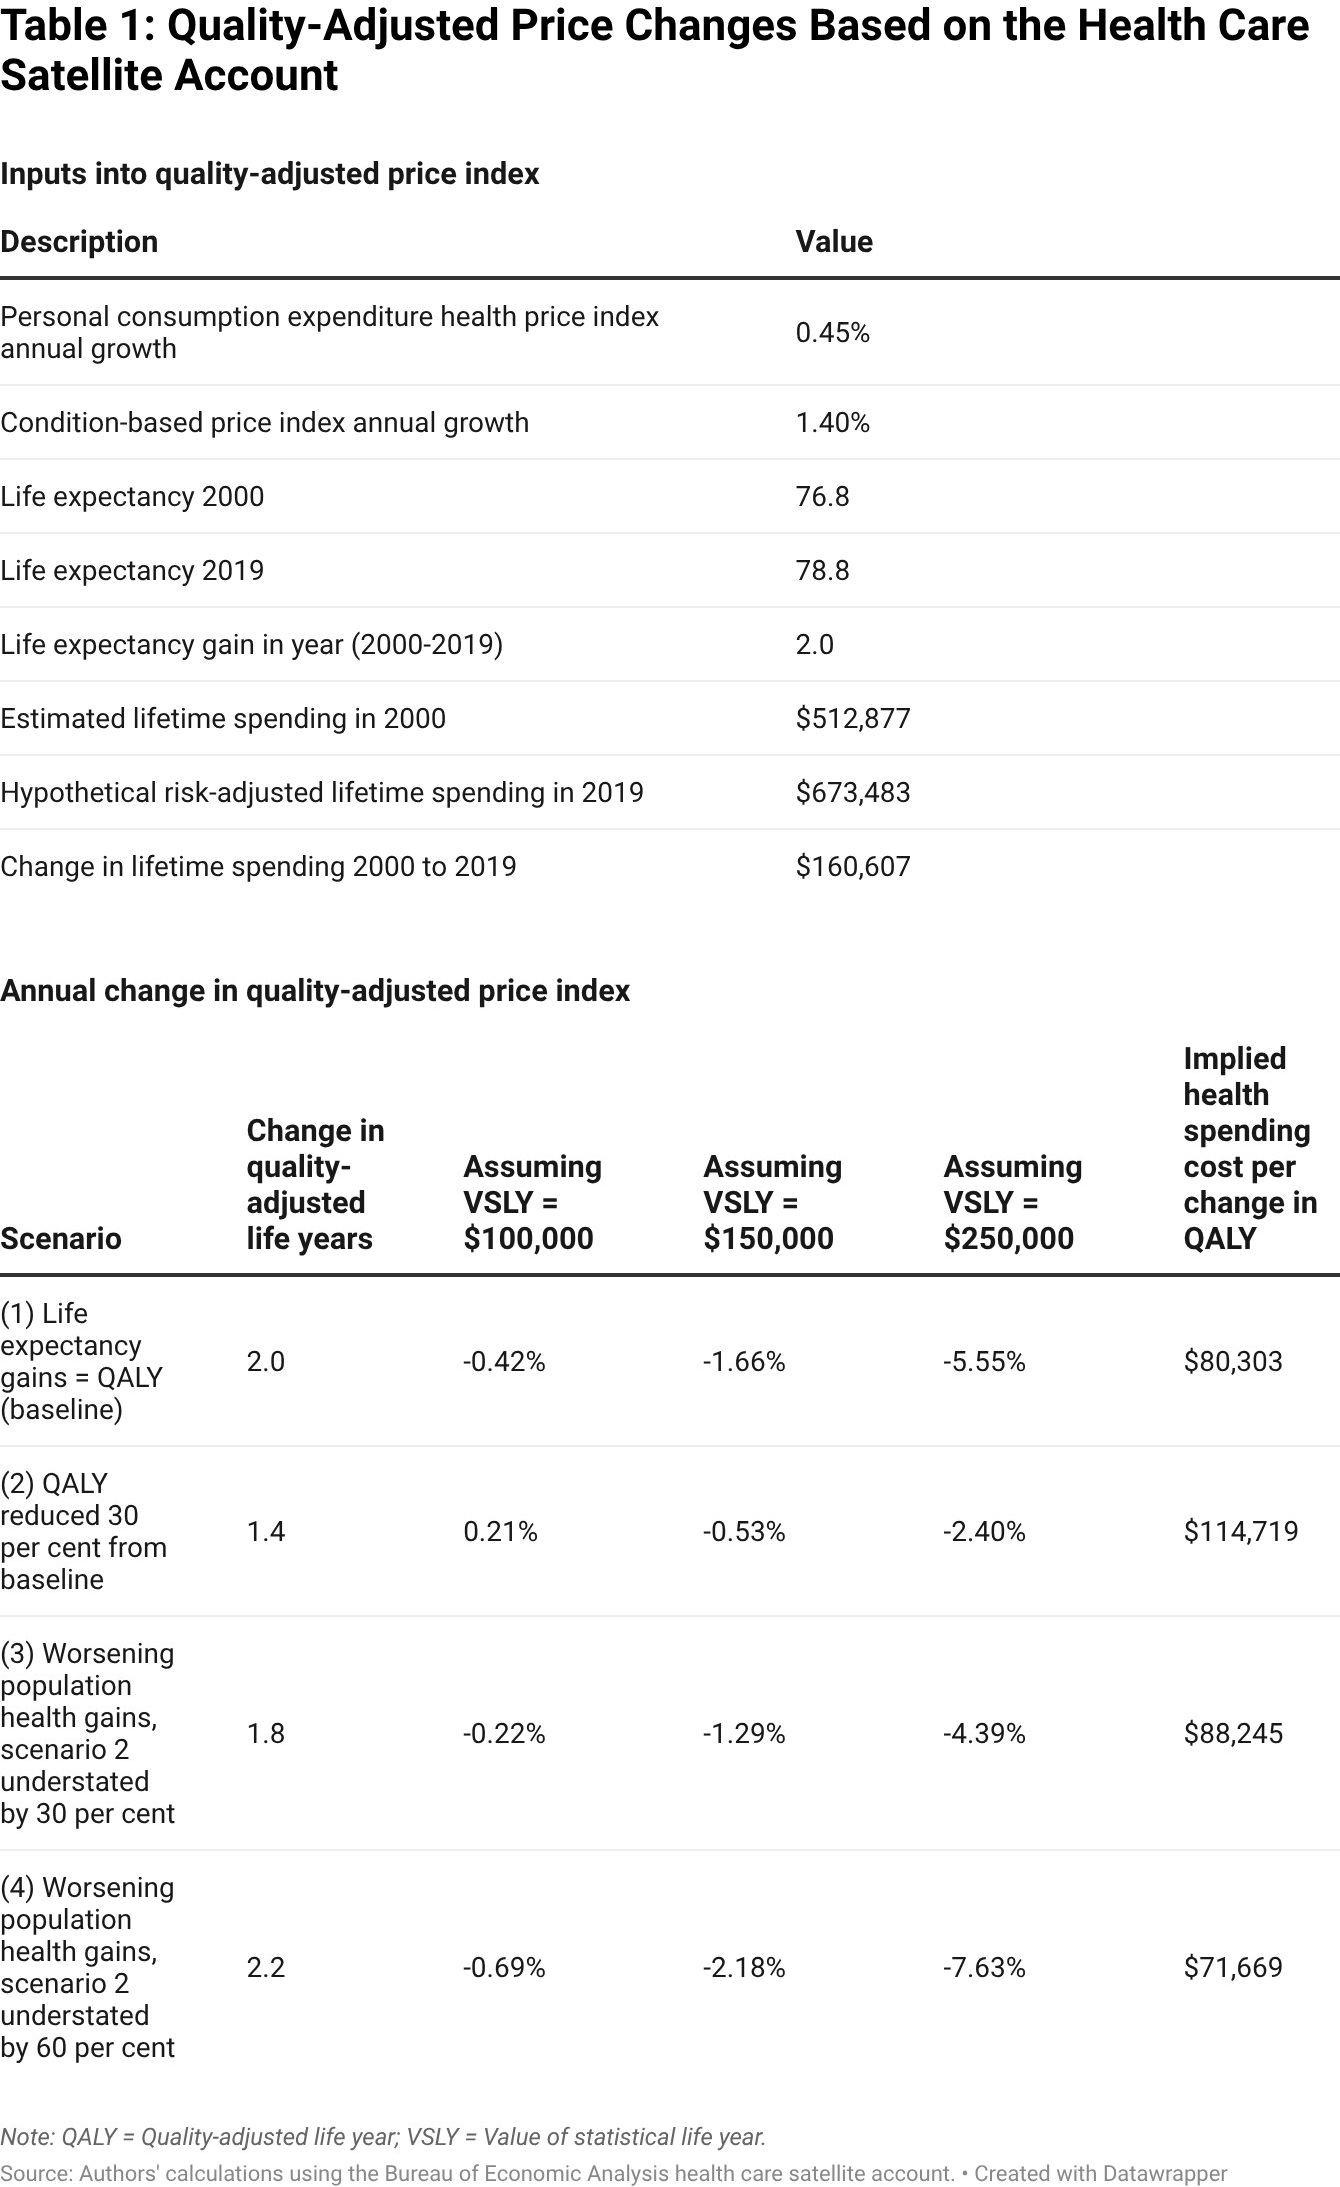
Key inputs are shown in the top panel of Table 1. All inputs are deflated by the aggregate PCE index and all of the expenditure computations in Table 1 are lifetime computations from birth. The first row shows that the PCE health index grows faster than overall inflation by 0.45 per cent per year. The condition-based price index increases considerably faster, as discussed previously, 1.4 per cent per year faster than economy-wide inflation, consistent with Figure 2. The next three rows show the life expectancy for 2000 and 2019, along with the gain in life expectancy. Life expectancy increased by roughly 2 years during our sample period. The base period lifetime spending in 2000 is $512,877.23 Multiplying the HCSA condition-based price index by the base period lifetime spending implies hypothetical lifetime spending of $673,483 in 2019, or an increase of $160,607 in lifetime spending for a population of similar health in 2019, relative to 2000.
Using this information, we form a variety of estimates to better gauge the value of medical care spending. We start with a simple but important benchmark, Scenario (1), where we assume all of the life expectancy change may be attributable to the health care sector. Scenario (1) on the bottom panel of Table 1 also ignores disability and assumes that the QALY gains equal the life expectancy change. In this scenario, spending change per year of life expectancy gained equals $80,303, because life expectancy rose by 2 years and spending by $160,607. For a VQALY of $100,000 this implies an annual quality-adjusted price decline of 0.42 per cent, relative to economy-wide inflation.24 Using VQALY from $150,000 or $250,000, which is a range more consistent with recent estimates from Kearsley (2024), we find the price index falling substantially faster, from about 1.66 per cent to 5.55 per cent per year.
In the next row (Scenario 2), we reduce the growth in quality-adjusted life expectancy, reflecting the fact that the additional life years that individuals gain may be in less than perfect health. We follow Cutler et al. (2022) who find that QALY gains are 30 per cent less than the life expectancy gains over the period of study. This adjustment reduces the value of medical care spending substantially. With a VSLY of $100,000, we find that quality-adjusted prices rise by 0.21 per cent annually, rather than fall by 0.42 per cent in Scenario (1).
Finally, in the last two rows, we assume that the underlying health of the population has worsened for non-medical reasons, implying the observed change in health due to medical care is understated. This assumption is consistent with trends in underlying population health in the U.S. Due to rising obesity rates and drug abuse (see Mokdad et al., 2024), it may be argued that the underlying population health has declined over time due to non-medical factors. For the 65 and over population, Cutler et al. (2022) decompose how much of the change in health is due to medical and non-medical factors. Over the period from 1999 to 2012, they find that the gains in health due to medical care are larger than gains in health generally, as obesity, among other factors, has reduced health. Because of this, they find changes in quality-adjusted life expectancy understate the impact of medical care by about 60 per cent for the 65 and over population. Given that we are analyzing spending and outcomes at birth, this estimate from Cutler et al. (1998) may not apply directly. Therefore, we analyze a range of estimates. In the last two scenarios (3 and 4) we assume gains in health from medical care are understated by 30 per cent or 60 per cent, relative to Scenario 2. We choose 30 per cent as our preferred estimate, in addition to 60 per cent, as we are analyzing a younger, potentially healthier population. Based on these adjustments, the central estimates show the quality-adjusted price index falling for most scenarios. Interestingly, across all four scenarios the quality-adjusted price index falls below the PCE health price index growth of 0.45 per cent per year over this period, implying a potential bias in the official price measure in the sector across the range of scenarios. The bias is the difference between the current PCE health price index and the quality-adjusted price index. For example, for our preferred Scenario (3) assuming the VSLY of $150,000, correcting for the bias would decrease the price index by 1.74 per cent (= 0.45% – -1.29%) per year. As the price indexes are sensitive to the VSLY, the last column reports the change in spending per life year saved as a measure of the growth in expenditures per quality improvement. In all scenarios, the spending per QALY increase is over $70,000, which may be of interest to policymakers considering the opportunity costs of these expenditures.
To check whether our approximation methodology provides plausible estimates, we compare our results to the much more in-depth estimates from Cutler et al. (2022). One important difference between our papers is that Cutler et al. (2022) focuses solely on the 65 and over population, while all of our calculations in Table 1 are lifetime calculations from birth. To make our results comparable, we recalculate life expectancy at 65 and lifetime spending at 65 in 2000, using age specific death rates and health care spending.25 The HCSA does not currently separate spending for those above or below 65, so we assume spending growth is similar for these two populations, which is an arguably strong assumption that we discuss below. After making these adjustments, the base period lifetime spending of a 65 year old is $295,738, the change in lifetime spending is $92,610, and the change in life expectancy is 1.7 years. This corresponds to a quality-adjusted price index decline of 2.09 per cent in Scenario 4, with a VSLY of $100,000. With the same assumptions regarding the VSLY and the share of health improvements due to medical care, we apply our formula to estimates from Cutler et al. (2022) and find that the implied quality-adjusted price index falls by about 3.5 per cent per year.26 This is a bit lower than our estimates, but the over-65 population in the U.S. is insured by Medicare, which has regulated prices that grow less quickly over our study period. Private insurance is the most common insurance for those under age 65.27 If we factor in the lower price growth in the Medicare population, which grows over 1 percentage point slower than private insurers, then our estimate matches closely to those of Cutler et al. (2022).28
There are large differences in the quality-adjusted price index for the full population analyzed in Table 1, relative to the 65 and older population analyzed in Cutler et al. (2022). The reason for this large difference is that the health gains go primarily to those over 65, but the lifetime health spending is shared roughly evenly between the under and over-65 populations, so it appears that the value of medical care spending for the over-65 population is quite high. More precisely, about 85 per cent of the improvement in life expectancy is occurring for those older than 65, while about 53 per cent of the spending growth occurs below 65. One possibility is that the increase in spending is much more effective for the over-65 population. However, we think that the more likely reason for this difference is that health is an investment good, as in Grossman (1972), so that the spending below age-65 leads to better health outcomes post-65, highlighting the potential importance of studying the dynamics of the full population.
These estimates have implications for productivity measurement. To understand the implications, we adjust existing productivity estimates for health care from BLS. Analogous to equation 4, we can write the BLS Multifactor Productivity index as:
where is nominal output for health care in period , is nominal output in period 0, and is the BLS price deflator for health care. To account for the changes discussed above (e.g., quality adjustment and defining the output as the treatment of a condition), one could replace the BLS price deflator with our quality-adjusted price index by multiplying the productivity measure in equation 5 by .
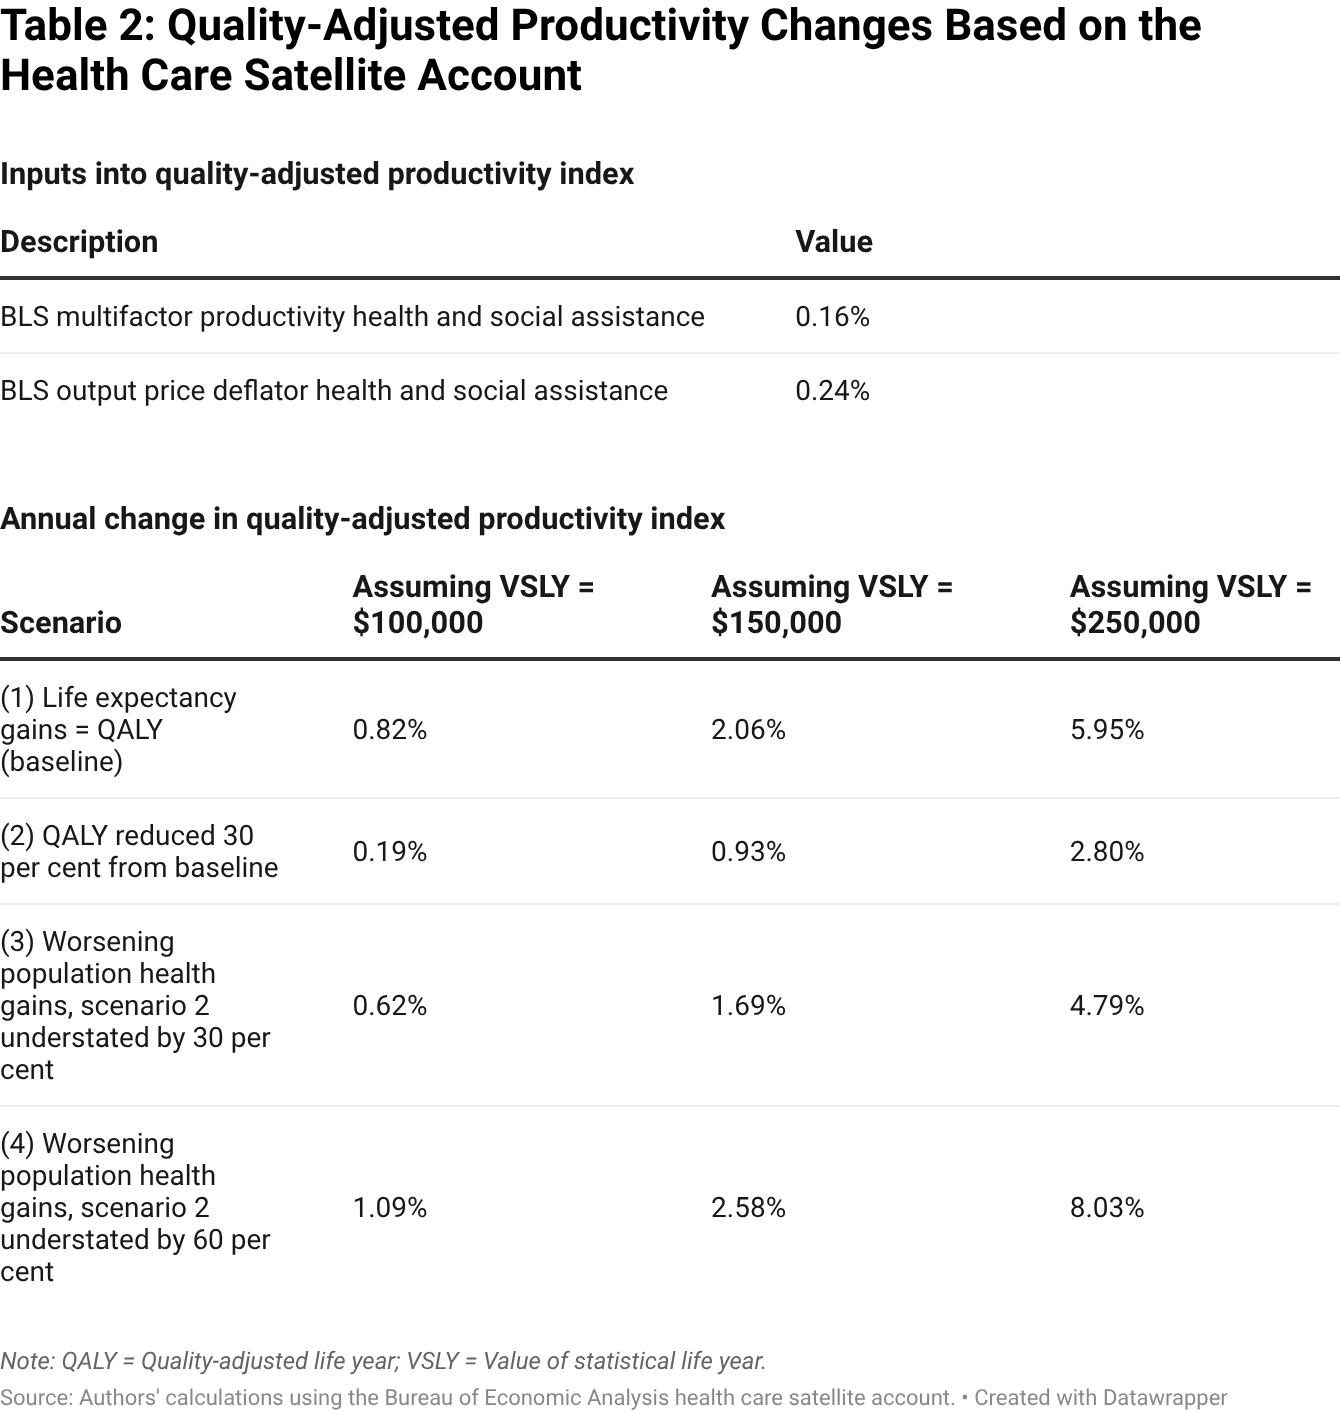
The top panel of Table 2 shows the inputs to this calculation. The BLS multifactor productivity change for the sector is relatively flat, with an increase of just 0.16 per cent per year. The output price deflator grows by 0.24 per cent per year relative to economy-wide inflation. Note that the BLS price measure we use is Health Care and Social Assistance (NAICS 62), which varies from the BEA measure of PCE Health. This sector includes hospitals and ambulatory care, but unlike PCE Health, it excludes pharmaceuticals and includes the category of social assistance.29 These differences are among the reasons that the BLS price deflator grows slower, 0.24 per cent versus 0.45 per cent, relative to the PCE health price index.
Table 2 shows how this adjustment impacts productivity measures. In Scenario (3), assuming a VSLY of $150,000, we calculate that the annual productivity growth is 1.69 per cent from 2000 to 2019, about a ten-fold difference in productivity. This implies a bias of 1.53 per cent (= 1.69% – 0.16%) per year. One can see that with this adjustment, the productivity estimate mirrors the quality-adjusted price index change. For example, in Scenario (4), assuming a VSLY of $100,000, our productivity estimate is 1.09 per cent per year, which implies a bias of 0.93 per cent (= 1.09% – 0.16%) per year, or a seven-fold difference in productivity.
Limitations: While we view this approach as providing a useful estimate for a quality-adjusted price, there are some important limitations. Most importantly, the paper relies on external information on population health and assumptions regarding how much of the population health change is due to medical care or other factors. The recent work by Cutler et al. (2022) provides some guidance suggesting that population health in the U.S. has likely worsened in recent years. The increase in disease prevalence in the HCSA is also indicative of worsening population health. Consistent with these estimates, Romley et al. (2020) examine eight health conditions around this time period and finds a health status index that worsens for seven out of eight conditions studied. There are also challenges with measuring health improvements based on population life-expectancy. For example, life-expectancy measures may not capture more complex dynamics, such as treatments that only have effects on health several years into the future.
Another important limitation is that our approach does not address the issue of clinical risk factors, like high cholesterol or diabetes, that can lead to more serious conditions, such as heart disease, that can lead to morbidity and death. If hypertension and high cholesterol increase in the population, this can lead to more heart disease cases. An important contribution of Cutler et al. (2022) is to develop an accounting system to reallocate spending and health changes from direct health conditions to risk factors like hypertension and high cholesterol. This more appropriately lines up spending and associated outcomes for each condition. Our analysis attempts to address this limitation by using health information from Cutler et al. (2022).
Another limitation of the analysis is its focus on aggregate estimates. We do not have health information at the condition level, which can be informative regarding the quality-adjusted prices and productivity of different treatments. More disaggregated information, by condition, geography, and demography, is necessary to better understand why productivity is changing. However, the benefit of our approach is that it can more quickly be applied to provide a more timely top-line measure. The estimate presented here is just an approximation, and more information is needed to improve the accuracy of these estimates. While comprehensive estimates are challenging due to the vast data required, Cutler et al. (2022) has demonstrated the feasibility for the over-65 population and the Institute of Health Metrics and Evaluation also demonstrates the feasibility of producing comprehensive estimates by providing disease outcome information for 204 countries (Vos et al., 2020).
6.2 Additional Evidence
A key limitation of the HCSA-based approach presented here and by Cutler et al. (2022) is that there may be numerous unobserved risk factors affecting the health of individuals with a particular condition. For instance, the health of a person with diabetes may be very different across individuals and over time, but individuals with a more severe case are often coded the same as someone with a less severe case. Detailed risk factors of the person may be difficult to account for using only population health data. There are a few complementary approaches that have been taken that generally support the findings presented here.
One approach is to produce estimates based on the expected quality from disease models, which use evidence in the clinical literature to predict health outputs based on information about health inputs and patient health (National Research Council, 2011). Cutler et al. (2022) introduces an alternative analysis using a disease model for cardiovascular treatment. This approach does not rely on population health outcomes and finds results consistent with the population-based approach for cardiovascular conditions. Eggleston et al. (2020) use disease models to examine the value of treatment for diabetes patients in four countries, and find the benefit of health improvement typically exceeds the cost.
Related to the disease model approach, Dunn et al. (2024) study 13 health conditions and use information on quality from the medical literature from the Tufts’ Cost Effectiveness Analysis Registry (CEAR). Specifically, they combine quality information from clinical studies with actual spending and treatment information using micro claims data. Many of the 13 conditions studied have expensive treatments that are patent protected, and quality-adjusted prices rise over the study period, highlighting that quality-adjusted prices do not necessarily fall. However, they project that in the long run, when drugs lose patent protection, quality-adjusted prices fall substantially for 12 of the 13 conditions.30 A potential advantage of the approach taken in these papers is that quality is not measured based on observed outcomes; it is based on the clinical literature that provides a measure of predicted health outcome. A disadvantage of this approach is that it does not directly explain health outcomes observed in the population. Moreover, as Hall (2017) points out, it may be challenging to model every separate condition and associated outcome. See Hall (2017) and Sheiner and Cutler (2024) for more detailed discussions of other papers in this literature.
Focusing on acute health conditions is another approach to help address this issue, as the acute health event itself and associated diagnosis codes provide key information about patient health. Due to the severity of these conditions, the outcome and the spending soon after the event can more readily be attributed to the health sector. This literature typically finds quality-adjusted prices declining rapidly (Cutler et al., 1998, for heart attacks; Dauda et al., 2022, for heart attacks, pneumonia, and heart failure). Examining eight health conditions, Romley et al. (2020) finds evidence of broad productivity improvement.
7. Conclusion
Accurately measuring productivity in the health care sector is essential for understanding the value of medical care spending, informing policy, and interpreting broader economic trends. However, traditional approaches do not adequately account for improvements in health outcomes and the substantial quality gains driven by medical innovation. This article demonstrates how the BEA’s health care satellite accounts can be combined with external data on health and life expectancy to produce quality-adjusted price indexes that better reflect changes in real output and productivity in the sector.
Consistent with a growing body of literature, our results indicate that quality-adjusted health care prices have declined relative to conventional price indexes, implying significant unmeasured productivity growth. Our estimates suggest that official statistics may understate real output growth in the health sector by roughly 1 per cent per year or more, depending on the value placed on health gains and adjustments for underlying population health trends.
These findings carry important implications. First, failing to account for health improvements can distort measures of sectoral productivity and bias assessments of living standards over time. Second, understanding how much of rising health care spending translates into improved health is central to ongoing debates over health care efficiency, pricing, and innovation policy. Improving these estimates could help better identify areas where productivity is lagging and where appropriate policy tools may be deployed. Finally, the framework presented here highlights the usefulness of condition-based health accounts and integration of health outcome data to support more accurate and actionable economic statistics.
While challenges remain, such as how to disentangle medical and non-medical contributors to health outcomes, the methodology outlined in this article provides a new, practical approach for improving the measurement of the health care sector.
References
- Abraham, K.G., R.S. Jarmin, B. Moyer, and M.D. Shapiro (2021) Big Data for Twenty-First-Century Economic Statistics, University of Chicago Press.
- Ackley, C.A. (2024) “The Impact of Preferred Provider Incentives on Demand and Negotiated Prices.”
- Ackley, C.A., A. Dunn, E. Dwibedi, L. Fernando, J. Joffe, J. Mallatt, C.J.L. Murray, J.L. Dieleman, and M.R. Weaver (2024) “The Value of Medical Care in the United States: Changes in Lifetime Spending and Health-Adjusted Life-Expectancy, 1996 to 2016,” Working Paper.
- Ackley, C.A., A. Dunn, and J. Romley (2026) “Quantifying Productivity Growth in Medical Care: Twenty Years of Evidence from Acute Health Conditions,” Working Paper.
- Ackerberg, D. and M. Rysman (2005) “Unobserved Product Differentiation in Discrete Choice Models: Estimating Price Elasticities and Welfare Effects,” RAND Journal of Economics, Vol. 36, No. 4, pp. 771–788.
- Aizcorbe, A. (2006) “Why Did Semiconductor Price Indexes Fall So Fast in the 1990s? A Decomposition,” Economic Inquiry, Vol. 44, No. 3, pp. 485–496.
- Aizcorbe, A., D.M. Byrne, and D.E. Sichel (2020) “Getting Smart About Phones: New Price Indexes and the Allocation of Spending Between Devices and Services Plans in Personal Consumption Expenditures,” in Measuring Economic Growth and Productivity, Elsevier, pp. 387–411.
- Aizcorbe, A. and N. Nestoriak (2011) “Changing Mix of Medical Care Services: Stylized Facts and Implications for Price Indexes,” Journal of Health Economics, Vol. 30, No. 3, pp. 568–574.
- Aizcorbe, A. and N. Nestoriak (2012) “Price Indexes for Prescription Drugs: A Review of the Issues,” The Oxford Handbook of the Economics of the Biopharmaceutical Industry, p. 438.
- Aizcorbe, A.M. and N. Nestoriak (2010) Price Indexes for Drugs: A Review of the Issues, BEA.
- Aizcorbe, A., G. Medeiros, and E. Strassner (2013) “Measuring Productivity for the US Health Sector,” Bureau of Economic Analysis Working Paper.
- Almond, D., J.J. Doyle Jr., A.E. Kowalski, and H. Williams (2010) “Estimating Marginal Returns to Medical Care: Evidence from At-Risk Newborns,” The Quarterly Journal of Economics, Vol. 125, No. 2, pp. 591–634.
- Anderson, G.F., U.E. Reinhardt, P.S. Hussey, and V. Petrosyan (2003) “It’s the Prices, Stupid: Why the United States is So Different from Other Countries,” Health Affairs, Vol. 22, No. 3, pp. 89–105.
- Arrow, K. (1962) “Economic Welfare and the Allocation of Resources to Invention,” in The Rate and Direction of Inventive Activity: Economic and Social Factors, Princeton University Press, pp. 609–626.
- Arrow, K.J. (1963) “Uncertainty and the Welfare Economics of Medical Care,” American Economic Review, Vol. 53, No. 5, pp. 941–973.
- Baumol, W.J. (1967) “Macroeconomics of Unbalanced Growth: The Anatomy of Urban Crisis,” The American Economic Review, Vol. 57, No. 4, pp. 415–426.
- Becker, G.S., T.J. Philipson, and R.R. Soares (2005) “The Quantity and Quality of Life and the Evolution of World Inequality,” American Economic Review, Vol. 95, No. 1, pp. 277–291.
- Benner, J.S., T.W. Smith, D. Klingman, J.C. Tierce, C.D. Mullins, N. Pethick, and J.C. O’Donnell (2005) “Cost-Effectiveness of Rosuvastatin Compared with Other Statins from a Managed Care Perspective,” Value in Health, Vol. 8, No. 6.
- Berndt, E.R., D.M. Cutler, R.G. Frank, Z. Griliches, J.P. Newhouse, and J.E. Triplett (2000) “Medical Care Prices and Output,” in Handbook of Health Economics, Vol. 1, Elsevier, pp. 119–180.
- Berndt, E.R., A. Bir, S.H. Busch, R.G. Frank, and S.-L.T. Normand (2002) “The Medical Treatment of Depression, 1991–1996: Productive Inefficiency, Expected Outcome Variations, and Price Indexes,” Journal of Health Economics, Vol. 21, No. 3, pp. 373–396.
- Bhat, A.A., I. Rashid, S.U. Hassan, and P. Kansra (2023) “Social Determinants of Health and Health Outcomes: A Bibliographic Review of the Scientific Literature from 2000 to 2021,” Global Knowledge, Memory and Communication, Vol. 74, No. 3, pp. 824–844.
- Bosworth, B., J. Bieler, M. Kleinrock, E. Koepcke, and E.R. Berndt (2018) “An Evaluation of the CPI Indexes for Prescription Drugs,” National Bureau of Economic Research.
- Bradley, R., J. Hunjan, and L. Rozental (2015) “Experimental Disease Based Price Indexes,” Bureau of Labor Statistics.
- Braveman, P., S. Egerter, and D.R. Williams (2011) “The Social Determinants of Health: Coming of Age,” Annual Review of Public Health, Vol. 32, No. 1, pp. 381–398.
- Brown, C., S. Sawyer, and D. Bathgate (2020) “A Review of Hedonic Price Adjustment Techniques for Products Experiencing Rapid and Complex Quality Change,” Bureau of Labor Statistics.
- Bryan, K.A. and H.L. Williams (2021) “Innovation: Market Failures and Public Policies,” in Handbook of Industrial Organization, Vol. 5, No. 1, Elsevier, pp. 281–388.
- Brynjolfsson, E., A. Collis, W.E. Diewert, F. Eggers, and K.J. Fox (2019) “GDP-B: Accounting for the Value of New and Free Goods in the Digital Economy,” NBER Working Paper, No. 25695.
- Byrne, D.M., S.D. Oliner, and D.E. Sichel (2018) “How Fast Are Semiconductor Prices Falling?” Review of Income and Wealth, Vol. 64, No. 3, pp. 679–702.
- Castanheira, M., C. Ornaghi, and G. Siotis (2019) “The Unexpected Consequences of Generic Entry,” Journal of Health Economics, Vol. 68, article 102243.
- Chandra, A., J. Holmes, and J. Skinner (2013) “Is This Time Different? The Slowdown in Healthcare Spending,” National Bureau of Economic Research.
- Chandra, A., A. Finkelstein, A. Sacarny, and C. Syverson (2016) “Health Care Exceptionalism? Performance and Allocation in the US Health Care Sector,” American Economic Review, Vol. 106, No. 8, pp. 2110–2144.
- Chandra, A. and J. Skinner (2012) “Technology Growth and Expenditure Growth in Health Care,” Journal of Economic Literature, Vol. 50, No. 3, pp. 645–680.
- Chant, E.D., M. Crawford, C.-W.W. Yang, E.S. Fisher, N.E. Morden, and I. Ganguli (2023) “Sources of Low-Value Care Received by Medicare Beneficiaries and Associated Spending Within US Health Systems,” JAMA Network Open, Vol. 6, No. 9, pp. e2333505.
- Chernew, M., A.M. Fendrick, and R.A. Hirth (1997) “Managed Care and Medical Technology: Implications for Cost Growth,” Health Affairs, Vol. 16, No. 2, pp. 196–206.
- Chernew, M.E. and J.P. Newhouse (2011) “Health Care Spending Growth,” in Handbook of Health Economics, Vol. 2, Elsevier, pp. 1–43.
- Chernew, M.E., A.L. Hicks, and S.A. Shah (2020) “Wide State-Level Variation in Commercial Health Care Prices Suggests Uneven Impact of Price Regulation,” Health Affairs, Vol. 39, No. 5, pp. 791–799.
- Chhatwal, J., F. Kanwal, M.S. Roberts, and M.A. Dunn (2015) “Cost-Effectiveness and Budget Impact of Hepatitis C Virus Treatment with Sofosbuvir and Ledipasvir in the United States,” Annals of Internal Medicine, Vol. 162, No. 6, pp. 397–406.
- Cockburn, I.M. and A.H. Anis (2001) “Hedonic Analysis of Arthritis Drugs,” in Medical Care Output and Productivity, University of Chicago Press, pp. 439–462.
- Congressional Budget Office (2022) “The Prices That Commercial Health Insurers and Medicare Pay for Hospitals’ and Physicians’ Services,” Congressional Budget Office.
- Cooper, Z., S.V. Craig, M. Gaynor, and J. Van Reenen (2019) “The Price Ain’t Right? Hospital Prices and Health Spending on the Privately Insured,” The Quarterly Journal of Economics, Vol. 134, No. 1, pp. 51–107.
- Curtiss, F.R. (2005) “Who Needs XR, LA, SR, XL, ER, or CR?” Journal of Managed Care Pharmacy, Vol. 11, No. 9.
- Cutler, D.M. (1995) “Technology, Health Costs, and the NIH,” Unpublished Paper Prepared for NIH Roundtable on Economics.
- Cutler, D.M. (2018) “What Is the US Health Spending Problem?” Health Affairs, Vol. 37, No. 3, pp. 493–497.
- Cutler, D.M., K. Ghosh, K.L. Messer, T.E. Raghunathan, S.T. Stewart, and A.B. Rosen (2019) “Explaining the Slowdown in Medical Spending Growth Among the Elderly, 1999–2012,” Health Affairs, Vol. 38, No. 2, pp. 222–229.
- Cutler, D.M. and D.P. Ly (2011) “The (Paper) Work of Medicine: Understanding International Medical Costs,” Journal of Economic Perspectives, Vol. 25, No. 2, pp. 3–25.
- Cutler, D.M. and M. McClellan (2001) “Is Technological Change in Medicine Worth It?” Health Affairs, Vol. 20, No. 5, pp. 11–29.
- Cutler, D.M., M. McClellan, J.P. Newhouse, and D. Remler (1998) “Are Medical Prices Declining? Evidence from Heart Attack Treatments,” Quarterly Journal of Economics, Vol. 113, No. 4, pp. 991–1024.
- Cutler, D.M., A.B. Rosen, and S. Vijan (2006) “The Value of Medical Spending in the United States, 1960–2000,” New England Journal of Medicine, Vol. 355, No. 9, pp. 920–927.
- Cutler, D.M., K. Ghosh, K.L. Messer, T. Raghunathan, A.B. Rosen, and S.T. Stewart (2022) “A Satellite Account for Health in the United States,” American Economic Review, Vol. 112, No. 2, pp. 494–533.
- Dauda, S., A. Dunn, and A. Hall (2022) “A Systematic Examination of Quality-Adjusted Price Index Alternatives for Medical Care Using Claims Data,” Journal of Health Economics, Vol. 85, article 102662.
- Dattani, S., L. Rod\'{e}s-Guirao, H. Ritchie, E. Ortiz-Ospina, and M. Roser (2023) “Life Expectancy,” Our World in Data.
- Deaton, A. and P. Schreyer (2022) “GDP, Wellbeing, and Health: Thoughts on the 2017 Round of the International Comparison Program,” Review of Income and Wealth, Vol. 68, No. 1, pp. 1–15.
- Dieleman, J.L., J. Cao, A. Chapin, C. Chen, Z. Li, A. Liu, C. Horst, A. Kaldjian, T. Matyasz, K.W. Scott, and others (2020) “US Health Care Spending by Payer and Health Condition, 1996–2016,” JAMA, Vol. 323, No. 9, pp. 863–884.
- Dieleman, J.L., M. Beauchamp, S.W. Crosby, D. DeJarnatt, E.K. Johnson, H. Lescinsky, T. McHugh, I. Pollock, M. Sahu, V. Swart, and others (2025) “Tracking US Health Care Spending by Health Condition and County,” JAMA.
- Dilokthornsakul, P., M. Patidar, and J.D. Campbell (2017) “Forecasting the Long-Term Clinical and Economic Outcomes of Lumacaftor/Ivacaftor in Cystic Fibrosis Patients with Homozygous Phe508del Mutation,” Value in Health, Vol. 20, No. 10, pp. 1329–1335.
- DiMasi, J.A., R.W. Hansen, and H.G. Grabowski (2003) “The Price of Innovation: New Estimates of Drug Development Costs,” Journal of Health Economics, Vol. 22, No. 2, pp. 151–185.
- DiMasi, J.A., H.G. Grabowski, and R.W. Hansen (2016) “Innovation in the Pharmaceutical Industry: New Estimates of R&D Costs,” Journal of Health Economics, Vol. 47, pp. 20–33.
- Duan, N. (1983) “Smearing Estimate: A Nonparametric Retransformation Method,” Journal of the American Statistical Association, Vol. 78, No. 383, pp. 605–610.
- Duflos, G. and F.R. Lichtenberg (2012) “Does Competition Stimulate Drug Utilization? The Impact of Changes in Market Structure on US Drug Prices, Marketing and Utilization,” International Review of Law and Economics, Vol. 32, No. 1, pp. 95–109.
- Dunn, A., L. Fernando, and E. Liebman (2023) “A Direct Measure of Medical Innovation on Health Care Spending: A Condition-Specific Approach,” Health Management Policy and Innovation, Vol. 8, No. 2.
- Dunn, A., L. Fernando, and E. Liebman (2024) “How Much Are Medical Innovations Worth? A Detailed Analysis Using Thousands of Cost-Effectiveness Studies.”
- Dunn, A., A. Hall, and S. Dauda (2022) “Are Medical Care Prices Still Declining? A Re-Examination Based on Cost-Effectiveness Studies,” Econometrica, Vol. 90, No. 2, pp. 859–886.
- Dunn, A., L. Rittmueller, and B. Whitmire (2015) “Introducing the New BEA Health Care Satellite Account,” Survey of Current Business, Vol. 95, No. 1, pp. 1–21.
- Dunn, A., L. Rittmueller, and B. Whitmire (2016) “Health Care Spending Slowdown from 2000 to 2010 Was Driven by Lower Growth in Cost per Case, According to a New Data Source,” Health Affairs, Vol. 35, No. 1, pp. 132–140.
- Dunn, A., B. Whitmire, A. Batch, L. Fernando, and L. Rittmueller (2018) “High Spending Growth Rates for Key Diseases in 2000–14 Were Driven by Technology and Demographic Factors,” Health Affairs, Vol. 37, No. 6, pp. 915–924.
- Dynan, K. and L. Sheiner (2018) “GDP as a Measure of Economic Well-Being,” Hutchins Center Working Paper, No. 43.
- Eggleston, K., B.K. Chen, C.-H. Chen, Y.I. Chen, T. Feenstra, T. Iizuka, J.T. Lam, G.M. Leung, J.-f.R. Lu, B. Rodriguez-Sanchez, and others (2020) “Are Quality-Adjusted Medical Prices Declining for Chronic Disease? Evidence from Diabetes Care in Four Health Systems,” The European Journal of Health Economics, Vol. 21, pp. 689–702.
- Einav, L. and A. Finkelstein (2023) We’ve Got You Covered: Rebooting American Health Care, Penguin.
- Feenstra, R.C. (1994) “New Product Varieties and the Measurement of International Prices,” The American Economic Review, pp. 157–177.
- Fiore, J.A., A.J. Madison, J.A. Poisal, G.A. Cuckler, S.D. Smith, A.M. Sisko, S.P. Keehan, K.E. Rennie, and A.C. Gross (2024) “National Health Expenditure Projections, 2023–32: Payer Trends Diverge as Pandemic-Related Policies Fade,” Health Affairs, Vol. 43, No. 7, pp. 910–921.
- Finkelstein, A., M. Gentzkow, and H. Williams (2016) “Sources of Geographic Variation in Health Care: Evidence from Patient Migration,” The Quarterly Journal of Economics, Vol. 131, No. 4, pp. 1681–1726.
- Fisher, E.S., D.E. Wennberg, T.A. Stukel, D.J. Gottlieb, F.L. Lucas, and E.L. Pinder (2003a) “The Implications of Regional Variations in Medicare Spending. Part 1: The Content, Quality, and Accessibility of Care,” Annals of Internal Medicine, Vol. 138, No. 4, pp. 273–287.
- Fisher, E.S., D.E. Wennberg, T.A. Stukel, D.J. Gottlieb, F.L. Lucas, and E.L. Pinder (2003b) “The Implications of Regional Variations in Medicare Spending. Part 2: Health Outcomes and Satisfaction with Care,” Annals of Internal Medicine, Vol. 138, No. 4, pp. 288–298.
- Fisher, F.M. and K. Shell (1972) The Economic Theory of Price Indices, Academic Press, New York and London.
- Frank, R.G., E.R. Berndt, A.B. Busch, and A.F. Lehman (2004) “Quality-Constant ‘Prices’ for the Ongoing Treatment of Schizophrenia: An Exploratory Study,” The Quarterly Review of Economics and Finance, Vol. 44, No. 3, pp. 390–409.
- Garber, A.M. and J. Skinner (2008) “Is American Health Care Uniquely Inefficient?” Journal of Economic Perspectives, Vol. 22, No. 4, pp. 27–50.
- Gastala, N.M., P. Wingrove, A. Gaglioti, S. Petterson, and A. Bazemore (2016) “Medicare Part D: Patients Bear the Cost of ‘Me Too’ Brand-Name Drugs,” Health Affairs, Vol. 35, No. 7.
- Giugliano, R.P., T.R. Pedersen, J.L. Saver, P.S. Sever, A.C. Keech, E.A. Bohula, S.A. Murphy, S.M. Wasserman, N. Honarpour, H. Wang, A.L. Pineda, and M.S. Sabatine (2020) “Stroke Prevention with the PCSK9 Inhibitor Evolocumab Added to Statin in High-Risk Patients with Stable Atherosclerosis,” Stroke, Vol. 51, No. 5.
- Glied, S. and A. Sacarny (2018) “Is the US Health Care System Wasteful and Inefficient? A Review of the Evidence,” Journal of Health Politics, Policy and Law, Vol. 43, No. 5, pp. 739–765.
- Goodman, D.C., E.S. Fisher, J.E. Wennberg, and J.S. Skinner (2008) “Tracking the Care of Patients with Severe Chronic Illness: The Dartmouth Atlas of Health Care 2008.”
- Gowrisankaran, G. and M. Rysman (2012) “Dynamics of Consumer Demand for New Durable Goods,” Journal of Political Economy, Vol. 120, No. 6, pp. 1173–1219.
- Groshen, E.L., B.C. Moyer, A.M. Aizcorbe, R. Bradley, and D.M. Friedman (2017) “How Government Statistics Adjust for Potential Biases from Quality Change and New Goods in an Age of Digital Technologies: A View from the Trenches,” Journal of Economic Perspectives, Vol. 31, No. 2, pp. 187–210.
- Grossman, M. (1972) “On the Concept of Health Capital and the Demand for Health,” Journal of Political Economy, Vol. 80, No. 2, pp. 223–255.
- Hall, A.E. (2017) “Adjusting the Measurement of the Output of the Medical Sector for Quality: A Review of the Literature,” Medical Care Research and Review, Vol. 74, No. 6, pp. 639–667.
- Hall, R.E. and C.I. Jones (2007) “The Value of Life and the Rise in Health Spending,” The Quarterly Journal of Economics, Vol. 122, No. 1, pp. 39–72.
- Hartman, M., A.B. Martin, B. Washington, A. Catlin, and the National Health Expenditure Accounts Team (2021a) “National Health Care Spending in 2020: Growth Driven by Federal Spending in Response to the COVID-19 Pandemic,” Health Affairs, Vol. 41, No. 9.
- Hartman, M., A.B. Martin, D. Lassman, A. Catlin, and the National Health Expenditure Accounts Team (2021b) “National Health Care Spending in 2019: Steady Growth for the Fourth Consecutive Year,” Health Affairs, Vol. 40, No. 1, pp. 14–24.
- Hemphill, C.S. and B.N. Sampat (2012) “Evergreening, Patent Challenges, and Effective Market Life in Pharmaceuticals,” Journal of Health Economics, Vol. 31, No. 2.
- Highfill, T. and E. Bernstein (2019) “Using Disability Adjusted Life Years to Value the Treatment of Thirty Chronic Conditions in the US from 1987 to 2010: A Proof of Concept,” International Journal of Health Economics and Management, Vol. 19, No. 3–4, pp. 449–466.
- Ho, K. and A. Pakes (2024) “Evaluating Pharmaceutical Policy Options,” National Bureau of Economic Research.
- Hofmeister, M.G., E.M. Rosenthal, L.K. Barker, E.S. Rosenberg, M.A. Barranco, E.W. Hall, B.R. Edlin, J. Mermin, J.W. Ward, and A.B. Ryerson (2019) “Estimating Prevalence of Hepatitis C Virus Infection in the United States, 2013–2016,” Hepatology, Vol. 69, No. 3, pp. 1020–1031.
- Hopkins, J. (2021) “House Committee Takes On Pricing, Patents for Top-Selling Drug Humira,” Wall Street Journal.
- Hult, K.J., S. Jaffe, and T.J. Philipson (2018) “How Does Technological Change Affect Quality-Adjusted Prices in Health Care? Systematic Evidence from Thousands of Innovations,” American Journal of Health Economics, Vol. 4, No. 4, pp. 433–453.
- January, C.T., J.S. Alpert, H. Calkins, J.E. Cigarroa, J.C. Cleveland, J.B. Conti, P.T. Ellinor, M.D. Ezekowitz, M.E. Field, K.T. Murray, R.L. Sacco, W.G. Stevenson, C.M. Tracy, and C.W. Yancy (2014) “2014 AHA/ACC/HRS Guideline for the Management of Patients With Atrial Fibrillation,” Circulation, Vol. 130, No. 23.
- January, C.T. and S.L. Wann (2019) “2019 AHA/ACC/HRS Focused Update of the 2014 AHA/ACC/HRS Guideline for the Management of Patients With Atrial Fibrillation,” Circulation, Vol. 140, No. 2.
- Jaruzelski, B., R. Chwalik, and B. Goehle (2018) “What the Top Innovators Get Right,” strategy+ business, Vol. 93.
- Jena, A.B. and T.J. Philipson (2008) “Cost-Effectiveness Analysis and Innovation,” Journal of Health Economics, Vol. 27, No. 5, pp. 1224–1236.
- Kakani, P., M. Chernew, and A. Chandra (2020) “Rebates in the Pharmaceutical Industry: Evidence from Medicines Sold in Retail Pharmacies in the U.S.,” NBER Working Paper, No. 26846.
- Kaplan, R.M. and A. Milstein (2019) “Contributions of Health Care to Longevity: A Review of 4 Estimation Methods,” The Annals of Family Medicine, Vol. 17, No. 3, pp. 267–272.
- Kearsley, A. (2024) “HHS Standard Values for Regulatory Analysis, 2024,” Technical Report, Assistant Secretary for Planning and Evaluation, Health and Human Services.
- Kesselheim, A.S., J. Avorn, and A. Sarpatwari (2016) “The High Cost of Prescription Drugs in the United States: Origins and Prospects for Reform,” JAMA, Vol. 316, No. 8, pp. 858–871.
- Kyle, M. and H. Williams (2017) “Is American Health Care Uniquely Inefficient? Evidence from Prescription Drugs,” American Economic Review, Vol. 107, No. 5, pp. 486–490.
- Lakdawalla, D., A. Malani, and J. Reif (2017) “The Insurance Value of Medical Innovation,” Journal of Public Economics, Vol. 145, pp. 94–102.
- Lebow, D.E. and J.B. Rudd (2003) “Measurement Error in the Consumer Price Index: Where Do We Stand?” Journal of Economic Literature, Vol. 41, No. 1, pp. 159–201.
- Lichtenberg, F.R. (2024) “Has Pharmaceutical Innovation Reduced the Average Cost of US Health Care Episodes?” International Journal of Health Economics and Management, Vol. 24, No. 1, pp. 1–31.
- Lin, G., M. Whittington, D. Niktin, F. Agboola, A. McKenna, S. Herron-Smith, S. Pearson, and J. Campbell (2023) “Oral and Monoclonal Antibody Treatments for Relapsing Forms of Multiple Sclerosis: Effectiveness and Value,” Institute for Clinical and Economic Review.
- Lopez, C., H. Roh, and B. Butler (2020) “How to Identify Health Innovation Gaps?”
- Lu, Z.J. and W.S. Comanor (1998) “Strategic Pricing of New Pharmaceuticals,” Review of Economics and Statistics, Vol. 80, No. 1, pp. 108–118.
- Lucarelli, C. and S. Nicholson (2009) “A Quality-Adjusted Price Index for Colorectal Cancer Drugs,” National Bureau of Economic Research.
- Lucarelli, C., S. Nicholson, and N. Tilipman (2022) “Price Indices and the Value of Innovation with Heterogeneous Patients,” Journal of Health Economics, Vol. 84, article 102625.
- Mahipal, A. and A. Grothey (2016) “Role of Biologics in First-Line Treatment of Colorectal Cancer,” Journal of Oncology Practice, Vol. 12, No. 12.
- Mallatt, J., A. Dunn, and L. Fernando (2024) “Consumer Out-Of-Pocket Drug Prices Grew Faster Than Prices Faced By Insurers After Accounting For Rebates, 2007–20,” Health Affairs, Vol. 43, No. 9, pp. 1284–1289.
- Marmot, M. and R.G. Wilkinson (2006) “Social Determinants of Health, 2nd Edition,” International Journal of Epidemiology, Vol. 35, No. 4, p. 1111.
- Matsumoto, B. and others (2021) Producing Quality Adjusted Hospital Price Indexes, US Department of Labor, US Bureau of Labor Statistics.
- Meltzer, D. (1997) “Accounting for Future Costs in Medical Cost-Effectiveness Analysis,” Journal of Health Economics, Vol. 16, No. 1, pp. 33–64.
- Meltzer, D.O. and P.C. Smith (2011) “Theoretical Issues Relevant to the Economic Evaluation of Health Technologies,” in Handbook of Health Economics, Vol. 2, Elsevier, pp. 433–469.
- Millman, J. (2014a) “This Drug Costs \$1,125 per Pill and Is About to Shatter Sales Records,” The Washington Post.
- Millman, J. (2014b) “Does It Really Cost \$2.6 Billion to Develop a New Drug?”
- Milken Institute (2020) “How to Identify Health Innovation Gaps? Insights from Data on Diseases’ Costs, Mortality, and Funding,” Working Paper.
- Mokdad, A.H., C. Bisignano, J.M. Hsu, H.S. Ababneh, R. Abbasgholizadeh, A. Abdelkader, and others (2024) “The Burden of Diseases, Injuries, and Risk Factors by State in the USA, 1990–2021: A Systematic Analysis for the Global Burden of Disease Study 2021,” The Lancet, Vol. 404, No. 10469, pp. 2314–2340.
- Montero, A., A. Kearney, L. Hamel, and M. Brodie (2022) “Americans’ Challenges with Health Care Costs,” Kaiser Family Foundation.
- Murphy, K.M. and R.H. Topel (2006) “The Value of Health and Longevity,” Journal of Political Economy, Vol. 114, No. 5, pp. 871–904.
- National Research Council (2002) At What Price?: Conceptualizing and Measuring Cost-of-Living and Price Indexes, National Academies Press.
- National Research Council (2011) Accounting for Health and Health Care: Approaches to Measuring the Sources and Costs of Their Improvement, National Academies Press.
- Nelson, R.R. (1959) “The Simple Economics of Basic Scientific Research,” Journal of Political Economy, Vol. 67, No. 3, pp. 297–306.
- Neumann, P.J., J.T. Cohen, and M.C. Weinstein (2014) “Updating Cost-Effectiveness — The Curious Resilience of the \$50,000-per-QALY Threshold,” New England Journal of Medicine, Vol. 371, No. 9, pp. 796–797.
- Newhouse, J.P. (1992) “Medical Care Costs: How Much Welfare Loss?” Journal of Economic Perspectives, Vol. 6, No. 3, pp. 3–21.
- Nolte, E. and M. McKee (2011) “Variations in Amenable Mortality — Trends in 16 High-Income Nations,” Health Policy, Vol. 103, No. 1, pp. 47–52.
- Nordhaus, W.D. (1972) “Is Growth Obsolete?” Economic Research.
- Nordhaus, W.D. (2004) “Schumpeterian Profits in the American Economy: Theory and Measurement,” National Bureau of Economic Research.
- Olek, M.J. and E. Mowry (2022) “Initial Disease-Modifying Therapy for Relapsing-Remitting Multiple Sclerosis in Adults,” UpToDate.
- Ortiz-Ospina, E. and M. Roser (2017) “Healthcare Spending,” Our World in Data.
- Pakes, A. (2003) “A Reconsideration of Hedonic Price Indexes with an Application to PC’s,” American Economic Review, Vol. 93, No. 5, pp. 1578–1596.
- Park, S., J.L. Dieleman, M.R. Weaver, G. Bae, and K. Eggleston (2025) “Health Care Spending Increases and Value in South Korea,” JAMA Health Forum, Vol. 6, No. 1, pp. e245145.
- Peter G. Peterson Foundation (2020) “How Does the US Healthcare System Compare to Other Countries?”
- Petrin, A. (2002) “Quantifying the Benefits of New Products: The Case of the Minivan,” Journal of Political Economy, Vol. 110, No. 4, pp. 705–729.
- Philipson, T.J. and A.B. Jena (2006) “Who Benefits from New Medical Technologies? Estimates of Consumer and Producer Surpluses for HIV/AIDS Drugs,” Forum for Health Economics & Policy, Vol. 9, No. 2.
- Preston, S.H. and A. Stokes (2011) “Contribution of Obesity to International Differences in Life Expectancy,” American Journal of Public Health, Vol. 101, No. 11, pp. 2137–2143.
- Ridker, P.M., E. Danielson, F.A.H. Fonseca, J. Genest, A.M. Gotto Jr., J.J.P. Kastelein, W. Koenig, P. Libby, A.J. Lorenzatti, J.G. MacFadyen, B.G. Nordestgaard, J. Shepherd, J.T. Willerson, and R.J. Glynn (2008) “Rosuvastatin to Prevent Vascular Events in Men and Women with Elevated C-Reactive Protein,” New England Journal of Medicine, Vol. 359, No. 21.
- Ridley, D.B. and S. Zhang (2017) “Regulation of Price Increases,” International Journal of Industrial Organization, Vol. 50, pp. 186–213.
- Rind, D., D.A. Ollendorf, R. Chapman, and others (2016) “Treatment Options for Advanced Non-Small Cell Lung Cancer: Effectiveness, Value and Value-Based Price Benchmarks,” Institute for Clinical and Economic Review.
- Roehrig, C. and M. Daly (2015) “Prevalence Trends for Three Common Medical Conditions: Treated and Untreated,” Health Affairs, Vol. 34, No. 8, pp. 1320–1323.
- Romley, J.A., A. Dunn, D. Goldman, and N. Sood (2020) “Quantifying Productivity Growth in the Delivery of Important Episodes of Care Within the Medicare Program Using Insurance Claims and Administrative Data,” in Big Data for Twenty-First-Century Economic Statistics, University of Chicago Press.
- Romley, J.A., D.P. Goldman, and N. Sood (2015) “US Hospitals Experienced Substantial Productivity Growth During 2002–11,” Health Affairs, Vol. 34, No. 3, pp. 511–518.
- Sanger-Katz, M. (2021) “U.S. Health Spending Reaches Record High in 2020,” The New York Times.
- Schmalensee, R. (1982) “Product Differentiation Advantages of Pioneering Brands,” The American Economic Review, Vol. 72, No. 3, pp. 349–365.
- Schreyer, P. (2012) “Output, Outcome, and Quality Adjustment in Measuring Health and Education Services,” Review of Income and Wealth, Vol. 58, No. 2, pp. 257–278.
- Schroeder, S.A. (2007) “We Can Do Better — Improving the Health of the American People,” New England Journal of Medicine, Vol. 357, No. 12, pp. 1221–1228.
- Schwartz, W.B. (1987) “The Inevitable Failure of Current Cost-Containment Strategies: Why They Can Provide Only Temporary Relief,” JAMA, Vol. 257, No. 2, pp. 220–224.
- Shapiro, I., M.D. Shapiro, and D.W. Wilcox (2001) “A Price Index for Cataract Surgery,” in Medical Output and Productivity, University of Chicago Press for the National Bureau of Economic Research, pp. 411–438.
- Sharpe, A., H. Messinger, and C. Bradley (2007) The Measurement of Output and Productivity in the Health Care Sector in Canada: An Overview, Centre for the Study of Living Standards.
- Sharma, D., S. Xing, Y.-T. Hung, R.N. Caskey, M.L. Dowell, and D.R. Touchette (2018) “Cost-Effectiveness Analysis of Lumacaftor and Ivacaftor Combination for the Treatment of Patients with Cystic Fibrosis in the United States,” Orphanet Journal of Rare Diseases, Vol. 13, pp. 1–12.
- Sheiham, A. (2009) “Closing the Gap in a Generation: Health Equity Through Action on the Social Determinants of Health,” Community Dental Health, Vol. 26, No. 1, pp. 2–3.
- Sheiner, L. (2014) “Why the Geographic Variation in Health Care Spending Cannot Tell Us Much About the Efficiency or Quality of Our Health Care System,” Brookings Papers on Economic Activity, Vol. 2014, No. 2, pp. 1–72.
- Sheiner, L. and D.M. Cutler (2024) “Measuring Prices and Productivity in the Health Care Sector,” in The Measure of Economies: Measuring Productivity in an Age of Technological Change, University of Chicago Press, pp. 225–262.
- Sheiner, L. and A. Malinovskaya (2016) “Measuring Productivity in Healthcare: An Analysis of the Literature,” Hutchins Center on Fiscal and Monetary Policy at Brookings.
- Shrank, W.H., T.L. Rogstad, and N. Parekh (2019) “Waste in the US Health Care System: Estimated Costs and Potential for Savings,” JAMA, Vol. 322, No. 15, pp. 1501–1509.
- Small, K.A. and H.S. Rosen (1981) “Applied Welfare Economics with Discrete Choice Models,” Econometrica, pp. 105–130.
- Smith, S., J.P. Newhouse, and M.S. Freeland (2009) “Income, Insurance, and Technology: Why Does Health Spending Outpace Economic Growth?” Health Affairs, Vol. 28, No. 5, pp. 1276–1284.
- Smith, S.D., J.P. Newhouse, and G.A. Cuckler (2022) “Health Care Spending Growth Has Slowed: Will the Bend in the Curve Continue?” NBER Working Paper, No. 30782.
- Solow, R.M. (1957) “Technical Change and the Aggregate Production Function,” The Review of Economics and Statistics, pp. 312–320.
- Syverson, C. (2017) “Challenges to Mismeasurement Explanations for the US Productivity Slowdown,” Journal of Economic Perspectives, Vol. 31, No. 2, pp. 165–186.
- Tabernero, J. (2015) “Proven Efficacy, Equitable Access, and Adjusted Pricing of Anti-Cancer Therapies: No ‘Sweetheart’ Solution,” Annals of Oncology, Vol. 26, No. 8.
- The Centers for Medicare and Medicaid Services (2015) “Medicare Drug Spending Dashboard,” Fact Sheet.
- The Centers for Medicare and Medicaid Services (2021) “Medicare Part D Spending by Drug (Historical); Medicaid Spending by Drug (Historical).”
- Tice, J.A., D.A. Ollendorf, H.S. Chahal, J.G. Kahn, E. Marseille, J. Weissberg, K.K. Shore, and S.D. Pearson (2015) “The Comparative Clinical Effectiveness and Value of Novel Combination Therapies for the Treatment of Patients with Genotype 1 Chronic Hepatitis C Infection: A Technology Assessment,” Institute for Clinical and Economic Review.
- Tice, J.A., R. Chapman, V. Kumar, P. Synnott, M. Seidner, and D.A. Ollendorf (2017) “Anabolic Therapies for Osteoporosis in Postmenopausal Women: Effectiveness and Value,” Institute for Clinical and Economic Review.
- Tice, J.A., R. Chapman, M. Seidner, D.M. Rind, S.D. Pearson, K.M. Kuntz, and K. Wherry (2020) “Modulator Treatments for Cystic Fibrosis: Effectiveness and Value,” Institute for Clinical and Economic Review.
- Tice, J.A., M. Richardson, A. Wright, M. Seidner, D.M. Rind, and S.D. Pearson (2023) “Special Assessment to Inform CMS Drug Price Negotiation: Eliquis and Xarelto,” Institute for Clinical and Economic Review.
- Tito, F., S. Mailankody, and A. Lo (2014) “Unintended Consequences of Expensive Cancer Therapeutics — The Pursuit of Marginal Indications and a Me-Too Mentality That Stifles Innovation and Creativity,” JAMA Otolaryngology — Head & Neck Surgery, Vol. 140, No. 12.
- Trajtenberg, M. (1989) “The Welfare Analysis of Product Innovations, with an Application to Computed Tomography Scanners,” Journal of Political Economy, Vol. 97, No. 2, pp. 444–479.
- Trajtenberg, M. (1990) “Product Innovations, Price Indices and the (Mis)measurement of Economic Performance,” National Bureau of Economic Research.
- Trogdon, J.G., E.A. Finkelstein, and T.J. Hoerger (2008) “Use of Econometric Models to Estimate Expenditure Shares,” Health Services Research, Vol. 43, No. 4, pp. 1442–1452.
- van der Gronde, T., C.A. Uyl-de Groot, and T. Pieters (2017) “Addressing the Challenge of High-Priced Prescription Drugs in the Era of Precision Medicine: A Systematic Review of Drug Life Cycles, Therapeutic Drug Markets and Regulatory Frameworks,” PLoS ONE, Vol. 12, No. 8.
- Viscusi, W.K. (2020) “Failing to Think Properly About the Value of a Statistical Life,” The Regulatory Review.
- Vos, T., S.S. Lim, C. Abbafati, K.M. Abbas, M. Abbasi, M. Abbasifard, M. Abbasi-Kangevari, H. Abbastabar, F. Abd-Allah, A. Abdelalim, and others (2020) “Global Burden of 369 Diseases and Injuries in 204 Countries and Territories, 1990–2019: A Systematic Analysis for the Global Burden of Disease Study 2019,” The Lancet, Vol. 396, No. 10258, pp. 1204–1222.
- Weaver, M.R., J. Joffe, M. Ciarametaro, R.W. Dubois, A. Dunn, A. Singh, G.W. Sparks, L. Stafford, C.J.L. Murray, and J.L. Dieleman (2022) “Health Care Spending Effectiveness: Estimates Suggest That Spending Improved US Health From 1996 to 2016,” Health Affairs, Vol. 41, No. 7, pp. 994–1004.
- Wennberg, J.E., M.M. Cooper, T.A. Bubolz, E.S. Fisher, A.M. Gittelsohn, D.C. Goodman, J.E. Mohr, J.F. Poage, S.M. Sharp, J. Skinner, and T.A. Stukel (1996) The Dartmouth Atlas of Health Care in the United States 1996, American Hospital Publishing, Inc., Chicago, IL.
- West Health and Gallup (2021) 2021 Health Care in America Report.
Footnotes
- Growth in the share of spending by the health care sector is from BEA (https://www.bea.gov/sites/default/files/2024-04/1959-2023-BEA-Data-Applying-NHEA-Framework.xlsx).
- See the National Center for Health Statistics (https://www.cdc.gov/nchs/data/hus/2020-2021/LExpMort.pdf).
- In more recent years, total factor productivity growth has been flat for NAICS 62, with an annual growth of 0.16 per cent over the 2000–2019 period, but hospital and nursing care productivity (NAICS 622–623) has continued to fall. See https://www.bls.gov/productivity/tables/.
- It is important to recognize that health outcomes are determined by numerous factors (including but not limited to behaviour and genetics), and that research suggests that medical care accounts for a fraction of the variation in health outcomes. For example, health care (or lack thereof) explains something like 10 per cent of premature mortality in the U.S.; see, among others, Schroeder (2007), Nolte and McKee (2011), and Kaplan and Milstein (2019). The social determinants of health (e.g., housing stability) are an important driver of outcomes, and have received considerable scholarly attention (Marmot and Wilkinson, 2006; Sheiham, 2009; Braveman et al., 2011; Bhat et al., 2023).
- This includes literatures in cost effectiveness, health services, health policy, and health economics. For example, the seminal Dartmouth Atlas of Health Care has documented and investigated widespread variation in how health care is delivered across the United States, in turn motivating a wide range of studies in allied health fields (Wennberg et al., 1996; Fisher et al., 2003 a; Fisher et al., 2003 b). This geographic variation has raised critical questions about why certain areas perform differently than others, leading scholars to assess, among other things, the role of low-value care (see, e.g., Chant et al., 2023).
- The BEA’s PCE health price index tracks prices for health care goods and services consumed by households and reflects payments by consumers, insurers, and government programs, and is used to measure inflation in the health sector within the national accounts.
- This productivity figure is for the period 2000 to 2019, while the negative productivity growth mentioned in the first paragraph is from 1990 to 2019. More generally, the productivity for the sector is typically flat or declining slightly.
- This number differs from the -1.3 per cent number in the previous paragraph because it assumes a VSLY of $100k to match Cutler et al. (2022).
- This decline for heart disease coincides with a period over which many drugs to treat heart disease lost patent protection. This pattern is also consistent with Lichtenberg (2024), which finds that in the long run, pharmaceutical innovations can lead to lower costs of treatment.
- Aizcorbe and Nestoriak (2012) is the first paper to construct condition-based estimates using claims data, providing an important foundation for the development of the HCSA.
- In this case, if there is no quality change, then the condition-based index would more accurately capture inflation, relative to the official PCE health price index, which measures the cost of a basket of specific goods and services year over year.
- Recent estimates in the literature, such as Cutler et al. (2022), do not apply discounting to spending or health improvements, which would lead to a statistical life year of $150,000 for a low-end estimate based on figures from Kearsley (2024).
- A similar Paasche-type price index could also be applied, as shown in Dauda et al. (2022).
- Spending needs to be measured in expected lifetime units to match the QALY measurement, which is in terms of the gain in health over a lifetime.
- For instance, a health condition that leads to a disability will reduce the QALY of a patient, even if the life expectancy does not change.
- The value is derived as: 0.61 = ($105,000 – $50,000*(9.4-8.28))/$81,000.
- Note that sufficiently large quality improvements can potentially yield a negative price index. There are three primary ways to address this issue. First, Dauda et al. (2022) apply chaining, which effectively scales down incremental quality gains at each step relative to costs. A second approach is to expand on the conditions over which quality adjustments are applied. By increasing total treatment expenditures, this helps ensure that the resulting price index remains positive. If chaining is not feasible and the application requires condition-specific price indexes, then a common solution is to use a reservation price index. Dunn et al. (2022) and Ackley et al. (2026), building on Trajtenberg (1990), use a reservation price index of the form: , where the quality adjustment enters the denominator. This index ensures that improvements in technology do not generate negative prices because the denominator represents the reservation price that leaves individuals in the base period indifferent between the new and prior technologies. While all three approaches are theoretically valid, they differ in the underlying baseline utility and technology being held fixed. The approximation used in this article follows the third approach.
- The unadjusted price index is 2 (i.e., $2,000/$1,000), while the adjusted price index that scales the price by the quality change is 1.33 (i.e., ($2,000/$1,000) × (10/15) = 1.333). If this adjustment is capturing the correct reservation price, then the expenditures necessary to make an individual indifferent to the new technology is just $1,333, so the dollar adjustment is $670 for five additional years of life.
Footnote 19: The price per QALY formula is:
If , then this formula matches equation 1.
- As applied in the U.S. National Accounts, deflators are applied to obtain real output.
- For example, suppose a treatment cost $20,000 in period , but the health produced from a treatment changed from 0.5 QALY to 0.6 QALY and , then based on the formula the output doubles, even though QALY increased by 20 per cent. The intuition is straightforward, as relative to the $20,000 in output received in period (the numerator), the output is the base period is $10,000 in value after accounting for the lower quality of treatment received in the base period. Patients are getting twice the output per dollar spent.
- Note that volume measures applied internationally are often counts for particular places of service (e.g., hospital volume or physician visit volume), whereas the volume measure here is the number of patients treated for the condition, across all places of service.
- This is computed using estimates of spending per capita by age from CMS combined with life expectancy tables for the year 2000 from the Center for Disease Control National Vital Statistics Report. In principle one could construct this again in 2019, but an advantage of the HCSA is that it holds the prevalence of conditions fixed across time, essentially holding the health of the population constant.
- The value 0.92 is the index value over the entire time period. Annualized over the 19 years, the value is 0.9958, so the annualized price change is \mbox{-0.42}\%. eta paste korlam to Tomar pasted equation-er correct conversion hobe: The value 0.92 is the index value over the entire time period. Annualized over the 19 years, the value is 0.9958, so the annualized price change is -0.42%.
- See the appendix for specific calculations for the over-65 age group.
- Specifically, we use their estimate of the change in lifetime spending and QALYs from Table 5 of Cutler et al. (2022). We compute base period lifetime spending using our methodology (but for 1999, which is the beginning of their sample period), as they do not report this number. We adjust all their numbers to be in 2019 dollars, rather than 2010 dollars.
- Based on estimates from the Bureau of Labor Statistics for hospitals, prices for individuals with private insurance grew by about 4 per cent per year, while prices for individuals with Medicare insurance grew 2.5 per cent per year.
- Specifically, as an alternative we lower the disease specific price by half the price difference between private and Medicare price growth (about 0.7 percentage points a year) to account for the slower growth of Medicare prices, and we find the associated quality-adjusted price falls by 3.5 per cent. After these adjustments, the similarity between our estimates provides some evidence that our methodology to approximate a quality-adjusted price index is reasonable. Details of this calculation are shown in the appendix, Section 8.3.
- However, social assistance accounts for less than 10 per cent of this category, so it primarily reflects productivity of the health sector.
- Similar to this study, Dunn et al. (2022) use available information from the medical literature to approximate a quality-adjusted price, but at a more aggregate level. Specifically, they use information on advances in medical technologies from cost-effectiveness literature, proxies for the diffusion of medical technology, and combine this information on the cost of treatment by medical condition from the HCSA. They also find quality-adjusted prices declining, similar to the population-based approach discussed in this article.