

Executive Summary
Canada’s effort to build a national early learning and child care system is one of the most significant social policy undertakings in recent decades. Five years after historic investments launched the Canada-Wide Early Learning and Child Care (CWELCC) system in 2021, major affordability gains have been achieved. With lower child care fees, maternal labour force participation has risen to near-record levels, which has spurred a notable increase in economic activity.
Despite the encouraging results, access constraints and workforce shortages are preventing some families from converting lower fees into realized child care use and expanded labour market participation. Unlocking the full return on Canada’s child care investment will require targeted actions to expand staffed spaces, strengthen the early childhood workforce, and ensure equitable access across regions and population groups.
- Affordability: Significant progress has been made on affordability. Between 2021 and 2022, average child care fees across regulated settings fell by more than half nationally, reaching $10 per day or less in five provinces and three territories as of March 2024. On top of these major reductions, among children aged 0 to 5 using child care, average annual parental expenses fell by roughly $1,400 between 2022 and 2025. The decline was even larger for centre-based care where average annual expenses fell by $2,400.
- Economic benefits: Maternal labour force participation has increased to near-record levels since CWELCC was introduced. Using Labour Force Survey microdata and a difference-in-differences regression methodology, we find that mothers of young children experienced larger increases in labour force participation and employment, compared with otherwise similar groups facing the same macroeconomic environment. Our central estimates imply that, by the end of 2025, roughly 29,000 additional mothers gained employment during the CWELCC expansion, resulting in a direct GDP gain of $2.7 billion per year (with a range of $2.1 billion to $3.9 billion annually across specifications).
- Access: Progress on access has been more uneven. Recent estimates reported by Employment and Social Development Canada show that 168,226 additional child care spaces were created as of March 31, 2025, relative to the target of 250,000 spaces by March 2026. Despite the expansion, waitlists have grown, and a rising share of parents report difficulty finding child care, limiting the extent to which lower fees translate into actual use.
- Workforce challenges: The early childhood workforce remains a key bottleneck to expanding the system. Although wages for early childhood educators and assistants (ECEAs) have risen faster than the economy-wide average since 2021, pay remains low, unfilled job vacancies are high, and ECEAs employment barely exceeds pre-pandemic levels.
- International evidence: Evidence from international experience and Quebec indicates that universal child care generates large economic returns. For example, after Quebec’s low-cost child care program was introduced in 1997, labour force participation of mothers with children under five increased by roughly 7 to 8 percentage points in that province relative to the rest of Canada. Moreover, long-run evidence finds that Quebec’s maternal earnings gains accumulated over mothers’ lifecycles and that the net present value of resulting fiscal benefits may have recaptured almost all the program’s upfront costs.
- Potential future returns: An illustrative scenario analysis suggests that resolving access barriers could unlock up to $15.6 billion in additional GDP, with a more conservative scenario yielding about $10.9 billion in 2025 alone. The gap between realized and potential returns is now driven less by affordability than by the inability to further scale up the system.
Introduction
Context: Canada’s $10-a-Day Child Care Initiative and CWELCC Agreements
Canada’s effort to build a national early learning and child care system is one of the most significant social policy undertakings in recent decades. The federal government set the foundation in Budget 2021 through a major five-year investment in early learning and child care, including more than $27 billion to build a Canada-wide system with provinces and territories and up to $30 billion when related ELCC investments, including Indigenous early learning and child care, are included. The Auditor General of Canada (2025) later described the broader five-year federal commitment to provincial, territorial, and Indigenous partners as $35 billion from April 2021 to March 2026. The goal of the CWELCC is to provide high-quality, affordable, flexible, and inclusive care for all families with young children. The federal plan established clear objectives to:
- reduce parent fees by 50 percent by the end of 2022;
- reach an average cost of $10 per day by March 2026;
- create 250,000 new regulated spaces; and
- strengthen the early childhood educator workforce through improved wages and professional supports.
This commitment was later reinforced through the Canada Early Learning and Child Care Act, passed in 2024, which established overarching goals and principles for the national system.
Implementation moved quickly as provinces and territories signed individual agreements outlining how these commitments would be implemented locally, with multi-year funding continuing until 2031 (notably, Alberta and Ontario signed only one-year extensions for 2026-2027 rather than the longer-term agreements signed by other jurisdictions). Indeed, the Auditor General of Canada (2025) found that federal funds were flowing as planned and that provinces and territories had spent roughly $12 billion of the $15 billion transferred to them between 2021 and 2024.
Significant progress has been made to lower child care fees. The Auditor General of Canada’s 2025 report finds that the average out-of-pocket fees for regulated child care spaces that received federal funding had fallen to approximately $16.50 per day across Canada by March 2024, from a baseline of $31 per day for full time care in early 2022. At that time, five provinces and three territories had already reached the $10-a-day target. As a rough illustration of the savings for families already in subsidized centre-based care: a reduction from $31 to $16.50 per day represents a saving of approximately $14.50 per day. Assuming five days of care per week, this translates to roughly $72.50 per week, approximately $314 per month, and approximately $3,770 per year.
Progress on space creation was also notable, but slower, with over 112,000 new licensed spaces added in the first three years of CWELCC by the end of March 2024 (Auditor General of Canada, 2025). More recent estimates report 168,226 spaces created as of March 31, 2025 (ESDC, 2026) and 194,000 spaces as of the third quarter of 2025 (Macdonald, 2026).1 By December 2025, provinces and territories had announced measures to create more than 200,000 spaces but announced spaces should be distinguished from spaces actually created, staffed, and available to families. It is also worth noting that a licensed space is not always an operational space as centres may hold a licence for spaces they cannot yet staff or open to families (this distinction is discussed further in Section 3.2).
At the same time, several challenges emerged. These include insufficient and inconsistent data on space creation, limited reporting on equitable access, and ongoing shortages of qualified early childhood educators, which complicated efforts to expand capacity at the pace required (Auditor General of Canada, 2025). Implementation of the CWELCC agreements has unfolded unevenly across provinces, reflecting differences in pre-existing child care systems, governance models, labour market conditions, and policy choices around funding and regulations.
Motivation: Evaluating Realized and Potential Economic Returns Matters
As Canada moves further into the implementation phase of the ten-dollar-a-day child care initiative, it is important to distinguish the economic gains that have already materialized, from those that are still to come. The early years of the Canada-wide system show clear progress in reducing parent fees, with average costs dropping by roughly half and many provinces now reaching or getting close to the ten-dollar target. These reductions have put meaningful money back into the pockets of families. Research has long shown that lower fees make it easier for mothers of young children to work more hours or return to paid employment sooner. ESDC (2025) finds that lower child care costs raise employment and hours worked, particularly for mothers of preschool-aged children and for single parents. Early provincial data also suggest rising demand for regulated care, as well as signs of increasing labour force attachment among mothers, although national labour market data may take time to fully reflect these changes.
However, measuring only realized gains is insufficient. The full economic return on Canada’s investment in child care depends on both affordability and access, and the evidence shows that access remains limited in many regions. Many families continue to live in what some researchers call “child care deserts” post CWELCC, particularly in rural and suburban communities. These gaps matter because without any actual space to use, families cannot fully benefit from lower fees, and the expected gains in employment, income and tax revenue cannot be realized.2
Provincial audits highlight these issues clearly. For example, although Ontario has created about 36,000 new spaces since 2019, enrolment among lower income families has dropped and waitlists remain widespread even while fees have fallen (Auditor General of Ontario, 2025). Ontario’s audit also highlights the distinction between licensed capacity and usable capacity. As of December 2023, about 80,500 CWELCC spaces, or 27 percent, did not have children enrolled because they were vacant or not operational. While the audit does not attribute all unused spaces to a single cause it points to insufficient monitoring and a mix of possible constraints, including staffing, infrastructure, operator capacity, and regional planning. Alberta’s April 1, 2025 affordability changes illustrate how fee design can affect equity. The province moved to a flat parent fee of $15 per day, or $326.25 per month for full-time care, eliminated the child care subsidy program, and allowed providers to charge optional supplemental fees. For many lower-income families that had previously received subsidies, this meant higher out-of-pocket fees and a greater risk of withdrawal from regulated care (Muttart Foundation, 2025).
Distinguishing between realized and potential returns allows governments and stakeholders to see where the system is performing well and where more targeted investments are needed. It helps identify regions where reduced fees have already translated into higher participation and income gains, as well as areas where parents remain on waitlists or cannot secure care that matches their work schedules. Most importantly, it reinforces that the promise of ten dollar a day child care depends not only on affordability but also on access, workforce stability, and the long-term capacity to sustain and grow the system.
Literature Review
International Evidence on the Economic Returns to Universal Child Care
A large international literature sees early learning and child care as a social investment that produces both short-term labour market gains and long-term economic and social returns. Recent OECD work concludes that high quality early childhood education and care is a cost-effective way to narrow skill gaps, support parental employment and reduce later spending on remedial education, social assistance and health care , especially when access is universal and fees are low for families with fewer resources (OECD 2025). The Alberta affordability review stresses that stable, well-staffed and pedagogically rich programs produce the largest gains for children from lower income families, with improvements in school readiness, later educational attainment and reduced poverty risks (Muttart Foundation 2025; OECD 2025).
On the labour market side, quasi-experimental studies of universal (or near universal) child care show consistent increases in maternal employment. In Spain, the roll out of full-time public child care for three-year-olds in the early 1990s led to roughly two additional mothers entering employment for every ten extra children who obtained a place, in a context where female employment had been low (Nollenberger and Rodríguez-Planas 2015). In the United States, expansions of publicly funded kindergarten for five-year-olds increased the employment rate of single mothers with estimates that around three mothers entered the labour force for every ten new kindergarten enrollees (Cascio 2009; Cascio and Schanzenbach 2013). Similar reforms in Germany that granted a legal entitlement to a part time kindergarten place for three- year-olds produced sizeable gains in maternal employment, especially among mothers who were previously out of the labour force (Dustmann et al. 2013). Studies of universal preschool in Mexico and Argentina also find positive impacts on mothers’ labour supply (Barros et al. 2011; Berlinski and Galiani 2007).
International work also links universal child care to long run human capital and fiscal returns. In Norway, a large expansion of subsidised centre-based care for three- to six-year-olds improved children’s educational attainment and later labour market outcomes, and reduced welfare dependence, with strongest effects for girls and children of mothers with lower education (Havnes and Mogstad 2011; Havnes and Mogstad 2015). In Spain, the same universal full-time program that raised maternal employment also led to better reading and math scores at age 15 and smoother grade progression, again concentrated among disadvantaged children (Felfe et al. 2016). A separate body of evidence on large scale but more targeted early childhood programs such as Head Start in the United States finds that gains in education, earnings and health for low-income participants generate benefits that substantially exceed program costs, implying high social rates of return to early investment (Deming 2009; Heckman et al. 2010). According to this literature, the strength of the economic payoff depends on three key conditions:
- Programs must be genuinely affordable to families,
- They must reach children who would otherwise have low quality or unstable care, and
- The services must be consistently high quality.
Evidence from Quebec’s Low-Fee Universal Child Care System
Quebec’s low fee child care system is the main Canadian example of a universal approach, and it has been extensively studied. The province introduced a single low daily fee in 1997 (initially five dollars per day and later indexed) alongside a rapid expansion of spaces in centres de la petite enfance and other regulated settings (Friendly et al. 2020). This created what is effectively a universal system for children aged one to five at fees that are very low compared to market prices elsewhere in Canada.
Several studies find that Quebec’s child care reforms produced large and sustained increases in maternal employment. The introduction of low fee universal child care increased the labour force participation of mothers with children under six by roughly 7 to 8 percentage points relative to the rest of Canada in the early 2000s and raised the use of regulated child care by about 15 percentage points (Baker et al. 2008). Lefebvre and Merrigan (2008) and Lefebvre et al. (2009), using a different data set and dynamic modelling, report similar gains in weeks and hours worked, with especially strong effects among less educated mothers.
A Statistics Canada analysis by Gu (2022), covering 1998 to 2015, finds that Quebec’s low-fee universal child care program was associated with changes in mothers’ paid employment and unpaid child care time relative to the rest of Canada.
Macro level analysis has translated these labour supply shifts into GDP and fiscal impacts. Fortin et al. (2012) estimate that by 2008 the low fee program had induced around 70,000 additional Quebec mothers to be employed, raising provincial GDP by roughly 1.5 to 2 percent and generating enough additional federal and provincial tax revenue to more than cover the net public cost of the program. Subsequent welfare analyses calculate a high marginal value of public funds for the Quebec reform, suggesting that each dollar of public spending generated significantly more than a dollar in social benefits once higher earnings, lower poverty and spillovers to future cohorts are taken into account (Brouillette et al., 2021; Montpetit et al., 2025). In the most recent study and drawing on 26 years of survey and administrative tax data, Baker et al. (2026) find that the employment gains for mothers persist long after children age out of preschool, while the earnings effect grows over time to about 27 percent by age 50. They further estimate that the resulting flow of fiscal benefits recaptures between 75 and 117 percent of the program’s upfront costs.
At the same time, Quebec’s experience underscores that the composition and quality of provision matter for child and family outcomes. Baker et al. (2015) found that for early cohorts the reform was associated with increased behavioural and health problems among children, and lower self-reported well-being among parents, even as maternal employment rose. Subsequent work such as Kottelenberg and Lehrer (2017) and Haeck et al. (2015) suggest that these adverse effects were concentrated in lower quality settings and among younger children, and that outcomes are more favourable when children attend higher quality centre-based care.
Overall, the Quebec literature points to strong labour market and fiscal returns from low fees and high coverage but also shows that maximizing long run social returns requires sustained attention to quality, workforce conditions and the mix of public, non-profit and for-profit providers.
Emerging Evidence from Canada Outside Quebec
Outside Quebec, earlier Canadian work focused on modelling the potential benefits of moving to a universal, publicly funded system. Cleveland and Krashinsky’s classic cost benefit study from the late 1990s argued that a major investment in high quality care for two- to five-year-olds in Canada would yield economic benefits that exceed program costs, once both the effects on children’s development and on mothers’ employment and earnings are counted (Cleveland and Krashinsky 1998). The same authors later examined affordability in Ontario and other provinces and argued that “Since individual families benefit from early learning and child care, and because the costs of care are high, it is not unreasonable to plan for some parental contribution for pre-kindergarten age services. The flat daily fee system in Quebec has much to recommend it.” (Cleveland and Krashinsky 2004). On the eve of the federal Canada-wide initiative, Cleveland and Krashinsky’s analysis showed that a flat ten dollars per day fee would dramatically reduce the share of the second earner’s income absorbed by child care for typical families in Ontario, Alberta and Manitoba, cutting the affordability barrier to employment and leaving most families paying well under 15 percent of the caregiving parent’s earnings in fees (Cleveland and Krashinsky 2020).
More recent federal modelling has tried to quantify how much additional employment and hours of work lower child care fees can plausibly generate in today’s Canadian context. ESDC (2025) finds that labour supply responses to lower fees are stronger for hours worked than for participation and are especially pronounced for single parents and lower income couple families, who face the steepest effective marginal tax rates when paying for care. These results are broadly consistent with international evidence that large affordability gains can unlock substantial additional paid work among caregivers with lower earnings and limited savings.
Since 2021, the Canada-wide early learning and child care initiative has begun to generate descriptive evidence on realized impacts. Federal reporting indicates that average regulated fees have fallen by at least 50 percent everywhere, and to ten dollars per day or less in many jurisdictions, while the labour force participation rate of mothers with children under six has reached record highs (ESDC, 2025).
Implementation reviews by auditors general highlight the gap between potential and realized economic returns thus far. The federal Auditor General concludes that while ESDC has provided substantial funding and helped improve educator wages, it still lacks robust performance data on whether the system is meeting objectives around access, inclusion and financial sustainability at the national level (Auditor General of Canada 2025).
Provincial Auditor General reviews consistently document rapid progress on fee reductions, but more mixed results on access, workforce capacity, and long-term financial sustainability. Auditor General of Ontario (2025) mentions a fundamental transition away from a market-driven, parent-fee-funded model toward one primarily financed through public operating grants in the province, with 92 percent of licensed spaces for children under six participating in CWELCC by the end of 2024 and parent fees falling by more than half. At the same time, Ontario fell short of its space creation targets, experienced a 31 percent decline in enrolment among families receiving fee subsidies as demand outpaced supply, and faces a projected funding gap of nearly $2 billion by 2026–27, raising concerns about the durability of fee reductions and workforce commitments. Audits from other provinces point to related but distinct challenges.3
In Saskatchewan, the Provincial Auditor finds that while fee reductions were implemented quickly, the province lacked sufficient planning tools and data to ensure new spaces were created where demand was highest, limiting gains in accessibility despite increased federal funding (Provincial Auditor of Saskatchewan, 2025). Alberta’s Auditor General similarly highlights weaknesses in program oversight and the design of affordability and grant mechanisms, noting risks that fee reductions and wage enhancements may not translate into sustained access if funding rules increase volatility for operators or raise costs for lower-income families (Auditor General of Alberta, 2025). Auditor General of British Columbia (2025) emphasizes that progress toward CWELCC-aligned access goals has been constrained by licensing backlogs and uneven regional capacity, even as the province expanded $10-a-day and fee-reduction programs.
These audits underscore that while CWELCC has delivered large and rapid affordability gains nationwide, the realized economic and social returns depend critically on province-specific success in expanding staffed spaces, stabilizing the early childhood workforce, and maintaining sustainable funding frameworks.
Overall, the international, Quebec and wider Canadian literatures suggest that a universal, low fee and high-quality child care system has the potential to generate large economic returns through higher maternal employment, stronger child development and reduced inequality. At the same time, they point to several conditions for realizing that potential in practice: fees must fall enough to change work incentives for lower income caregivers, space creation has to keep pace with demand, quality and workforce stability need sustained investment, and governance and ownership structures must support reinvestment in care rather than profit extraction.
Provincial Rollout Variations
Affordability Gains Under CWELCC
Affordability has been the clearest and fastest-moving dimension of the CWELCC reform. From the outset, the federal objective was to reduce average parent fees for regulated child care by 50 percent by the end of 2022 and to reach $10-a-day care on average by March 2026. This represents a sharp break from the pre-CWELCC pattern, when parent fees in most provinces rose steadily over time and often outpaced household income growth (Macdonald & Friendly, 2025).
Table 1 summarizes this variation in the timing and design of fee reductions across jurisdictions. It shows that the broad national pattern of declining parent fees was achieved through a range of institutional models, which helps explain why affordability gains have been substantial everywhere but not identical in pace, scale, or structure.
Figure 1 shows just how unusual this price shift has been in the broader inflation environment. After the CWELCC agreements were signed, the all-items Consumer Price Index continued to climb, rising at roughly 3.7 percent annually, while the child care price index moved sharply downward, falling at roughly 9.0 percent annually. In practical terms, this means that child care affordability improved not only because family incomes rose or inflation eased, but because public policy directly lowered the price families were paying.4
Figure 2 moves from aggregate price trends to household spending and shows that the drop in fees was visible across most types of care arrangements between 2022 and 2025. The largest reduction was in daycare centres, where parental expenses fell by about one-third, or roughly $2,463. At the broader average across all arrangements, parental expenses fell by about 21 percent, or roughly $1,402. Figure 2 also shows that the gains were not identical across all forms of care. Some arrangement types saw smaller declines, and one category, Care by a non-relative in the child’s home, increased by about 17 per cent, which suggests that affordability gains were concentrated most strongly in the regulated parts of the system that were directly targeted by CWELCC funding.
Figure 3 shows that most provinces experienced declines of at least about one-quarter in centre-based parental expenses, but the size of the reduction varied sharply. Prince Edward Island, Saskatchewan, and Ontario stand out as the largest percentage declines, while British Columbia saw the smallest reduction among the provinces shown. Looking at the dollar changes behind the percentages tells a similar story. Ontario recorded the largest decline in centre-based costs, at more than $4,000, while Saskatchewan saw a decline of
about $3,300, and Alberta and Manitoba each recorded declines of more than $2,000. This variation matters because it shows that provinces have moved toward the same federal target through different fee-reduction paths. The affordability story is therefore clearly positive, but it is not a story of full convergence to a common endpoint just yet.
Figure 4 adds an important distributional perspective by showing child care costs as a share of after-tax family income. This is the most policy-relevant affordability measure because it captures how burdensome child care remains after fees have fallen.
As of 2024, child care absorbs a smaller share of disposable income than it did before the policy in 2019. For most family types, that share was between 5 to 6 percent. This remains a meaningful expense, but it is clearly lower than before. Figure 4 also shows that the benefits are not evenly distributed across families. The biggest gains appear among single fathers, with about $1,900 in savings, and among couples with children, with about $1,000
in savings. The broader implication is that fee reductions are doing more than lowering posted prices. They are materially changing household budgets. As Figure A8 and A9 show, for many families, especially those balancing child care with work decisions, a lower share of income spent on care means more room for other essentials and a stronger financial payoff to employment.
The final set of bars in Figure 4 illustrates what this would look like under a fully realized $10-a-day system. If the target is achieved, the share of after-tax income devoted to child care would fall to roughly 2 to 3.5 percent across all family types. This represents the substantial additional decline that is needed to meet the stated affordability target of the program.
Child Care Accessibility
As shown in Figure 5, Panel A, in 2025, there were 771,900 children younger than 5 in child care across Canada (excluding Territories) who would not change their child care arrangement (Demand met) representing 35.2 per cent of all children in that age group, up from 672,300 children in 2023. Encouragingly, Panel B shows that the proportion of children in child care who would change their arrangement (i.e. those children whose demand was partially met) decreased to 17.9 per cent in 2025 from 19.3 in 2023. In the same time span, the share of children left out of child care (i.e. demand fully unmet) fell by 1 percentage point to 26.4 per cent from 602,400 to 580,400. These estimates point to a marginal improvement of child care arrangement availability to parents.
Focusing on centre-based child care, Figure 6 shows the scale and unevenness of this particular child care arrangement’s expansion between 2021 and 2025. At the national level, centre-based spaces for children aged 0 to 5 increased by roughly 126,000. In percentage terms, the fastest expansion occurred in Alberta, Newfoundland and Labrador, and Saskatchewan. In absolute terms, the largest gains were recorded in Alberta, Ontario, and Quebec. 5
Figure 7 turns from the amount of centre-based child care expansion to its composition. It shows that the post 2021 growth in centre-based spaces has been driven by both for-profit and non-profit providers, but with marked provincial differences in the mix. In several provinces, including Prince Edward Island, British Columbia, Alberta, New Brunswick, and Ontario, a large share of recent expansion has been for-profit. In other jurisdictions, non-profit growth has played a larger role.
This matters for two reasons. First, it shows that the stated objective of building a system that is primarily public and non-profit has translated very differently across provinces. Second, it suggests that the institutional form of expansion may shape the quality and stability of the system over time.
Figure 8 shows that most provinces saw higher use of care arrangements for children aged 0 to 5 over the period shown, with the most visible gains in the share of children using centre-based child care outside Nova Scotia, Quebec, and British Columbia. While it is true that CWELLC expansions have drawn more families into regulated care as evidenced by the increase in the number of children using centre-based (and regulated home-based space), lower fees do not automatically translate to increase share of children in centre-based child care in every jurisdiction. Local supply conditions, pre-existing system structure, and baseline centre-based coverage all appear to matter.
Figure A3 in Appendix F provides a more detailed picture of how child care use has evolved alongside the expansion of regulated spaces. Figure A3, Panel A shows that, among children aged 0 to 5 who use child care, centre-based care still accounts for the largest share of arrangements nationally, but that share fell from 59.2 percent in 2022 to 55.8 percent in 2025.
This indicates a shift in the composition of arrangements among children using care and does not imply that centre-based use fell in absolute terms nationally; indeed, the number of children in centre-based care rose over this period, even as its share of all arrangements declined. The provincial patterns of child care use are discussed in Appendix F.
Challenges: Difficulty Finding Child Care and Workforce Bottlenecks
Despite the substantial affordability gains achieved under CWELCC, access pressures have intensified rather than eased in many parts of the country. Figure 9 shows that among parents and guardians of children aged 0 to 5, the share reporting difficulty finding a child care arrangement rose substantially between 2022 and 2025.
This suggests that lower fees have increased demand more quickly than the system has been able to expand staffed capacity. The increase in reported difficulty was not uniform across provinces. Newfoundland and Labrador, Alberta, and British Columbia recorded the smallest increases, while Nova Scotia, Quebec, Ontario, Manitoba, and Saskatchewan experienced the largest deterioration. The overall message is that affordability gains have made child care more attractive and more financially feasible for families, but that this has also exposed the limits of current supply. In many jurisdictions, the central policy problem has shifted from high prices to insufficient availability.
Figure 10 shows that among children aged 0 to 5 who were not using child care, the share whose parents or guardians reported being on a waitlist rose nationally from 19.1 percent in 2022 to 30.9 percent in 2025. Waitlist rates were highest in Quebec at 56.1 percent, followed by Newfoundland and Labrador at 43.4 percent and Prince Edward Island at 43.3 percent. We caution that a higher proportion of children waitlisted for child care in a province does not mean that the province is having a poor coverage of child care. In fact Quebec has the highest share of children in regulated child care and relatively few children outside its regulated system compared to other larger provinces like Ontario or BC.
Their share of waitlisted children indicates the difficulty for those outside the regulated child care system to find new spots and comparing the changes within each province across time is insightful about the expansion of the system especially as it relates to its ability to provide services to more children. With that framing, the sharpest increases occurred across much of Atlantic Canada and the Prairies, including Nova Scotia, New Brunswick, Manitoba, and Saskatchewan. Appendix Figure B3 shows that waitlists also became more common among children already using child care, rising from 16.7 percent nationally in 2022 to 23.6 percent in 2025.
Workforce Bottlenecks
A central reason access has not kept pace with demand in some jurisdictions is the continued fragility of the early childhood care workforce, in particular early childhood educators and assistants (ECEAs). As Figure 11 illustrates, between 2021 and 2025, nominal offered wages for ECEAs (and home child care providers) remained consistently below the all-occupation average. Over the same period, nominal wage growth for ECEAs reached 26.8 percent, compared with 18.1 percent for all occupations.6 This represents meaningful progress, but it does not eliminate the underlying compensation gap.
The figure also shows that home child care providers narrowed their wage gap with ECEAs through much of 2024 and 2025, suggesting some tightening in labour market conditions across the broader child care sector.
Figure 12 reinforces that the pattern was far from uniform across provinces. Real offered wage7 growth for ECEAs was strongest in Newfoundland and Labrador, Manitoba, and Saskatchewan, while it was weak in Alberta, New Brunswick, and Ontario, and negative in Prince Edward Island.8
In 2025, ECEA vacancies remained elevated relative to 2021 and ECEA employment only modestly exceeded its pre-pandemic level despite a major policy-driven increase in demand for staffed spaces. Figure 13, Panel A shows that ECEA job vacancies increased sharply after 2021 and stood 42 percent higher in Q2 2025 than in Q1 2021. Panel B shows that ECEA vacancies rose faster than vacancies in the rest of the economy, indicating that child care employers have had greater difficulty filling positions than employers in other occupations.
Figure 14, Panel A extends the same point using employment data. Panel B shows that the share of ECE employment in overall employment continued to drift downward. The pace of ECEA workforce growth therefore remains out of line with the scale of system expansion now being attempted. In practical terms, this means that a licensed space is not always an operational space, and a funded expansion target is not always a staffed service.
A further workforce risk is that rapid expansion may place downward pressure on qualifications if providers struggle to recruit enough fully trained staff. Some evidence on ECE qualification and workforce trends is available from Akbari et al. (2024), which provides sector-level data on training, credentials, and workforce composition. This matters because the workforce challenge is not only about the number of workers available, but also about whether enough qualified educators are available to support service quality as the system expands.9 Seward et al., (2023) identifies a shortage of ECE training capacity in Canada, noting that post-secondary programs have not expanded sufficiently to meet the growing demand for qualified educators required by system expansion. It characterizes this gap as “The Big Short” in ECE human capital. This structural constraint may be compounded by major changes to federal immigration policy introduced in late 2024, including substantial reductions in work permits, which could intensify existing shortages of ECEA professionals, particularly in licensed child care settings that have relied on internationally trained workers to fill vacancies.
Data and Methodology
To estimate the labour market effects of the CWELCC agreements, this paper uses a difference-in-differences (DiD) framework applied to monthly microdata from Statistics Canada’s Labour Force Survey (LFS) Public Use Microdata Files. The analysis focuses on adults under age 54 with children in the household and uses pooled monthly observations over the 2015 to 2025 period, with the years before 2021 used to characterise baseline trends and to test the identifying assumptions described below.
A simple increase in maternal labour force participation after 2021 as illustrated in Figure 15 would not by itself identify the effect of CWELCC. Labour market outcomes for mothers were also shaped by the post-pandemic recovery, unusually tight labour markets, changing inflation conditions, evolving work arrangements, and broader demographic shifts. In addition, maternal employment was already trending differently across provinces before CWELCC, especially given Quebec’s longstanding low-fee child care system. For these reasons, the empirical challenge is not to document whether mothers’ employment increased after the reform, but whether groups more directly exposed to CWELCC experienced larger improvements than otherwise similar comparison groups facing the same broader macroeconomic environment. A DiD design is therefore more appropriate because it nets out common time effects and compares the labour market changes of more exposed and less exposed groups over the same period.
Because CWELCC was adopted nationwide, treatment cannot be defined simply by province. Identification instead comes from differential exposure to the policy across demographic groups. The analysis uses three complementary DiD designs that will be outlined in the next section. The main estimating equation is:
where is the labour market outcome for individual in province at time , identifies membership in the more policy-exposed group namely mothers with children under 6, and indicates the post-CWELCC period.
Province fixed effects absorb time-invariant provincial differences, while time fixed effects absorb all common monthly shocks, including the broad labour market swings of the pandemic period.
For the two within-province designs we also include province-by-treatment-group fixed effects, so the coefficient of interest is , which measures the differential change in the outcome for the treated group after CWELCC relative to the control group is identified within province and month.
The vector includes age group, marital status, education, immigrant status, and an indicator for residence in a census metropolitan area.
The main outcomes of interest are employment, labour force participation, unemployment, and usual weekly hours of work. The hours results are reported using both a conditional measure, observed only for the employed, and an unconditional measure that assigns zero hours to the non-employed.
Because treatment is defined by demographic exposure rather than by province, the identifying variation comes from differences between more and less exposed groups within the same province and month, a within-province comparison of early and late CWELCC signatories yields no differential effect, confirming that the rollout schedule itself carries little signal. Standard errors are clustered by province and, because the number of provincial clusters is small, every headline coefficient is also evaluated with a wild cluster bootstrap. We subject the results to an extensive battery of robustness checks, reported in the Appendix C, including event-study tests of pre-trends, placebo tests, the exclusion of Quebec, the exclusion of the acute pandemic months and pre-period linear time trends, province-by-month fixed effects, and checks for the influence of remote work.
Economic and Fiscal Impacts of Affordable Child Care
Labour Market Effects
Across all designs, the results point in the same direction: the introduction of lower-fee child care is associated with higher maternal employment, higher labour force participation, and higher total hours worked.
The first scenario comparing mothers whose youngest child is under age six with mothers whose youngest child is aged 6 to 12.10 The second compares mothers and fathers among parents whose youngest child is under age six. The third compares mothers of children under six in provinces outside Quebec with comparable mothers in Quebec, which already had a mature low-fee child care system before CWELCC. Together, these designs ask whether labour market outcomes improved more for those most directly exposed to lower-fee child care than for otherwise similar groups with weaker exposure.
The identifying assumption is that absent CWELCC, the treated and control groups in each design would have followed parallel trends after conditioning on the included controls and fixed effects. This assumption is most plausible in the first two designs, which compare groups within the same province and month, rather than relying only on cross-provincial contrasts. To assess this assumption, the analysis also examines event-study specifications that trace the treatment-control gap before and after implementation discussed in Appendix B.
As shown in Table 2, the first study yields a 1.92 percentage point increase in employment and a 2.44 percentage point increase in labour force participation among mothers with younger children following policy implementation. The unemployment coefficient is also positive, at 0.52 percentage points, consistent with stronger labour force entry, since participation rises somewhat more than employment and some newly entering mothers are observed searching for work.
On the hours margin, the unconditional measure rises by 0.76 hours per week, while the conditional-hours specification is small and statistically imprecise. As discussed below and in the Appendix C, the employment and participation effects are robust across a wide range of specifications, whereas the hours response is more sensitive, so we place greater weight on the extensive margin when interpreting the results and computing economic returns.
The results for the second design in Table 2 closely mirror the baseline findings for employment and participation, and in some cases are larger. Maternal employment rises by 1.87 percentage points relative to fathers, labour force participation rises by 2.76 percentage points, and unconditional weekly hours rise by 1.27 hours. The conditional-hours specification also shows a large positive increase of 0.78 hours per week among the employed. The positive unemployment coefficient again reflects increased labour force entry. Overall, this design reinforces the interpretation that the post-CWELCC labour market response was concentrated among mothers rather than reflecting a general parental labour market trend.11
The third design uses Quebec as a benchmark, comparing mothers with a youngest child under age six in non-Quebec provinces to comparable mothers in Quebec after July 2021. Because it relies on a single control cluster (Quebec), this design is best read as a benchmark or triangulation exercise rather than a formal inference design. As reported in Table 2, this design produces positive but somewhat smaller estimates than the first two designs: employment rises by 1.20 percentage points, labour force participation rises by 1.24 percentage points, and unconditional weekly hours rise by 0.83 hours. The unemployment coefficient is close to zero. The smaller coefficients are consistent with the idea that part of the gains outside Quebec reflect convergence toward a province that already had relatively more developed low-fee child care. Even so, the direction of effect remains the same as in the other two designs, strengthening confidence that the estimated gains are not driven by a single choice of comparison group.
The participation and employment results are stable across an extensive set of robustness checks reported in Appendix C. Excluding Quebec, the one province that already operated a mature low-fee system, leaves the effects intact and if anything slightly larger. Removing the most disrupted pandemic months does not change the findings. Replacing the province and month fixed effects with province-by-month fixed effects, which absorb every province-level shock including differential recoveries, sectoral booms, and the uneven rollout of remote work, leaves the estimates essentially unchanged. The effects are also positive across education groups and, for study 1, at least as large among mothers without a university degree, who hold less remote jobs and lower earnings, which is the opposite of what one would expect if remote work were driving the results. Taken together with the Quebec benchmark, which nets out the nationwide shift to remote work while holding the presence of young children constant, this evidence indicates that the gains reflect the easing of child care constraints rather than the parallel expansion of remote work in the immediate aftermath of the pandemic.
Using the baseline design, we translate the employment effect into the number of newly employed mothers. In the pre-treatment sample, the baseline employment rate of mothers with a youngest child under six was 69.9 percent. Applying the 1.92 percentage point employment effect to the 2025 reference population of about 1.53 million mothers under age 54 with a youngest child under six implies approximately 29,000 additional employed following the introduction of CWELCC. Because the 1.92 percentage point figure is a difference in the employment rate, it represents a persistent shift in the level of employment rather than a one-time inflow of workers: in an average month about 29,000 more mothers are employed than would otherwise be the case. Sustained over the year, that higher employment level corresponds to roughly 29,000 additional person-years of work, which is why the resulting output and fiscal gains are expressed as recurring annual flows rather than a single one-time gain. This interpretation assumes the employment effect persists, consistent with the event-study pattern and the longer-run Quebec evidence; were the effect to fade, the annual flow would be correspondingly smaller.
The second design, which compares mothers with fathers and nets out household-level confounders, yields a very similar employment effect of 1.87 percentage points, so the two most directly comparable designs reinforce one another.
GDP Estimates and Economic Returns
We next translate the labour market estimates into GDP effects. We assume newly employed mothers work 33.6 hours per week at $28.69 per hour and convert their labour income to GDP using a labour share of 0.55. This is a direct accounting conversion and not an estimate of sector-specific productivity or a full general-equilibrium model. Alternative population references, macro assumptions, and uncertainty ranges are reported in the Appendix D, where the full arithmetic is also set out.
Under these assumptions, the direct GDP effect is about $2.7 billion per year, arising almost entirely from the extensive margin of roughly 29,000 additional employed mothers. Across our robustness designs the estimate ranges from about $2.1 billion, under the most demanding pre-trend specification, to about $3.9 billion when Quebec is excluded, with the central specifications clustered near $2.7 billion to $3.2 billion.12
Fiscal Returns
We translate the labour-income gain into fiscal effects through four channels: additional personal income tax revenue (eq 2), additional payroll contributions (eq 3), additional indirect tax revenue from new labour income (eq 4), and reduced income-tested transfers (eq 5). The baseline formulas are:
so that the baseline short-run fiscal offset is:
denotes the annual increase in maternal labour income generated by the policy, while the parameters represent reduced-form effective rates that translate this income gain into fiscal effects. The superscripts identify the fiscal channel being measured: personal income tax, payroll contributions, indirect taxes, and transfer reductions. All effective fiscal rates are applied to incremental labour income, not to incremental GDP. GDP is estimated by grossing labour income up by the inverse of the labour share, while fiscal offsets are calculated from the labour-income base.
For personal income tax, we use a 17 percent effective rate on added maternal earnings.13 For payroll contributions, we use 15.6 percent in the broader public-finance estimate.14 For indirect taxes, we use an effective rate of 4.8 percent, corresponding to the assumption that part of new income is spent on goods and services facing GST/HST, while recognizing that tax rates vary across provinces from 5 percent GST to 13 percent HST in Ontario, 14 percent HST in Nova Scotia after April 1, 2025, and 15 percent HST in several Atlantic provinces, and that some key items such as basic groceries are zero-rated at 0 percent (Canada Revenue Agency 2025c). Finally, for transfer clawbacks we use a modest effective rate of 3 percent, reflecting the fact that higher earned income reduces some income-tested benefits but does not trigger a one-for-one offset.15 This is conservative relative to the structure of major income-tested benefits. For example, the Canada Child Benefit begins to phase down when adjusted family net income exceeds $37,487, with the reduction rate depending on the number of children (Canada Revenue Agency 2025d). The 3 percent rate used here is therefore intended as a reduced-form average across families rather than a statutory clawback rate.
Under these assumptions and applying the effective rates to the additional maternal labour income of about $1.47 billion generated by higher employment, the direct annual fiscal offsets are as follows. Personal income tax revenue rises by about $250 million. Payroll contributions rise by about $230 million. Indirect tax revenue from new labour income rises by about $71 million. Reduced transfer payments contribute a further $44 million. Summing personal income tax, indirect tax, and transfer reductions yields a core general-revenue offset of about $365 million per year, rising to about $595 million when payroll contributions are included.
The fiscal estimates are robust to reasonable alternative assumptions about effective tax rates and transfer clawbacks. As shown in Appendix E, varying the personal income tax rate, payroll contribution rate, indirect tax rate, and transfer clawback rate produces a range of annual fiscal offsets, but in all cases the increase in maternal labour supply continues to generate a substantial short-run fiscal return. These remain partial-equilibrium short-run estimates that exclude longer-run gains from persistent maternal earnings, child development, and other dynamic channels.
Latent Employment and GDP Gains from Easing Child Care Access
The realized gains obtained earlier represent only part of the economic potential of a fully accessible system. There are latent employment gains that remain locked behind the access bottleneck. The central metric here is the non-employment margin i.e. the number of parents who report that they have postponed their return to work specifically because of difficulties finding a suitable child care arrangement. This is a narrower and more conservative basis than total unmet demand, since it focuses on families who have already signaled a clear employment intention and a specific child care barrier, rather than the broader group with unmet demand more generally.
In 2025 approximately 212,000 children aged zero to five had a parent who was currently using child care and reported that they had postponed their return to work as a consequence of difficulties finding a suitable arrangement.16 A further 120,200 children not currently using child care had a parent in the same situation, bringing the combined total to approximately 332,200 families in which child care access difficulties are actively delaying labour market re-entry. These figures represent a 2025-level upper bound on the employment gains that could be unlocked by fully resolving the access constraint, contingent on creating the additional staffed spaces those families would require. Assuming that half of these families would actually return to paid employment once access barriers are removed yields a central estimate of approximately 166,000 additional employed parents.17 Applying the same wage and productivity assumptions used before (an average hourly wage of $28.69 and a labour share of 0.55) translates into an annual GDP gain of up to $15.6 billion. Under more conservative assumptions, with a 35 percent re-entry to labour market rate, the employment gain falls to around 116,000 and the associated GDP effect to approximately $10.9 billion. Even at the lower end of this range, the potential gain from solving the access problem is roughly four to six times larger than the annual realized gain already estimated. Applying the fiscal assumptions used in Section 5.3 to the labour-income component of the latent GDP scenarios implies core general-revenue offsets of roughly $1.5 billion to $2.1 billion per year, rising to about $2.4 billion to $3.5 billion when payroll contributions are included.
As Figure 16 shows, the provincial distribution of this latent potential is highly uneven. Ontario accounts for the largest share, with 75,700 children in child care and a further 61,400 not in child care whose parents report postponing return to work, a combined total implying a central GDP gain of roughly $6.4 billion annually if access constraints were resolved. Quebec records 56,400 such cases among current users, corresponding to at least $2.7 billion. British Columbia accounts for approximately 34,000 cases among users, or roughly $1.6 billion.
Three caveats should be kept in mind. First, these are partial equilibrium estimates that do not account for general equilibrium effects on wages or demand for spaces. Second, stated consequences would not map one-for-one onto actual labour market transitions. Third, and most importantly, these figures measure the potential gain from full access and not necessarily a projection of what current policy will achieve over any specific horizon.
Nevertheless, while affordability gains delivered by CWELCC are real and substantial, they represent only a fraction of the total economic return available once Canada’s child care access bottleneck is resolved.
Short-term Return on Investment
Table 3 provides a simple short-term return-on-investment comparison between the federal cost of CWELCC and the economic and fiscal gains estimated in this paper. The two cost
benchmarks come from the Auditor General (2025) five-year funding envelope: $30.7 billion for the Canada-wide system itself and $35.0 billion for the broader federal ELCC package, which also includes Indigenous ELCC, administration, and related initiatives. The Annual value column reports the estimated annual realized figures, while the 5-year cumulative / comparison value column either multiplies those annual gains by five or, in the case of the access-bottleneck row, reports the separate 2025-level latent GDP gain of $15.6 billion without annualizing it. The last two columns express each gain as a share of the two federal cost envelopes. On this basis, the estimated realized direct GDP gain of $2.7 billion per year implies a five-year cumulative gain of roughly $13.4 billion, equal to about 44 percent of the narrower CWELCC envelope and about 38 percent of the broader federal ELCC envelope. The corresponding five-year realized fiscal offsets are much smaller, at about $1.8 billion on the core measure and about $3.0 billion on the broader public-finance measure. The table also reports an illustrative total GDP gain of about $29 billion, obtained by adding the realized five-year direct GDP gain to the separate $15.6 billion estimate of GDP currently foregone because access bottlenecks prevent some families from translating lower fees into actual labour market participation.
These figures should be interpreted cautiously. They are not a full social cost-benefit analysis and they do not imply that the program has already paid for itself in fiscal terms. The realized rows capture only the short-run maternal labour-supply channel estimated in the paper and exclude longer-run gains from persistent earnings effects, child development, improved well-being, and other dynamic benefits. Conversely, the potential GDP gain row is not an automatic dividend: it represents the amount of output that could have been realized in 2025 if access constraints had not limited the use of affordable child care. Achieving gains of that magnitude on a sustained basis would require additional investment in workforce capacity, staffed spaces, and system quality. The findings here should therefore be read as a transparent short-run accounting exercise. They show that the policy already generates substantial measurable economic returns, while also illustrating that the much larger unrealized gains now lie on the access side of the system rather than the affordability side.
Discussion
Interpreting the “Access Bottleneck”: Where Affordability Has Not Translated Into Uptake
Affordability gains under CWELCC activated latent demand for regulated child care, but in several provinces the physical supply of spaces was insufficient to absorb that demand, producing what is best described as an access bottleneck. Figure 17 begins by documenting the relationship between the size of fee reductions and growth in child care use between 2022 and 2025. It shows that provinces with larger proportional fee cuts tended to see somewhat more growth in centre-based use and in combined centre and home-based use but neither correlation reaches statistical significance at ten observations. The stronger result for the combined measure is itself informative in that some fee-driven demand appears to have flowed into regulated home-based care when centre spaces were unavailable, suggesting that the two arrangements functioned as partial substitutes rather than independent options. Alberta stands apart in this figure because it recorded large use gains despite a comparatively small fee cut, which reflects the role of space expansion rather than price reduction in driving uptake there. Figure 18 draws out the supply-side interpretation more directly by plotting the size of each province’s fee cut against the change in reported difficulty finding child care. The near-zero correlation provides descriptive evidence that deeper fee reductions were not mechanically associated with smaller increases in reported difficulty finding care. Every province saw difficulty rise between 2022 and 2025, regardless of how aggressively fees were reduced. This is the defining characteristic of a supply-constrained market: lower prices succeed in activating demand, but when capacity does not expand in parallel.
Figure 17: Fee Reductions vs. Child Care Use Growth, 2022-2025
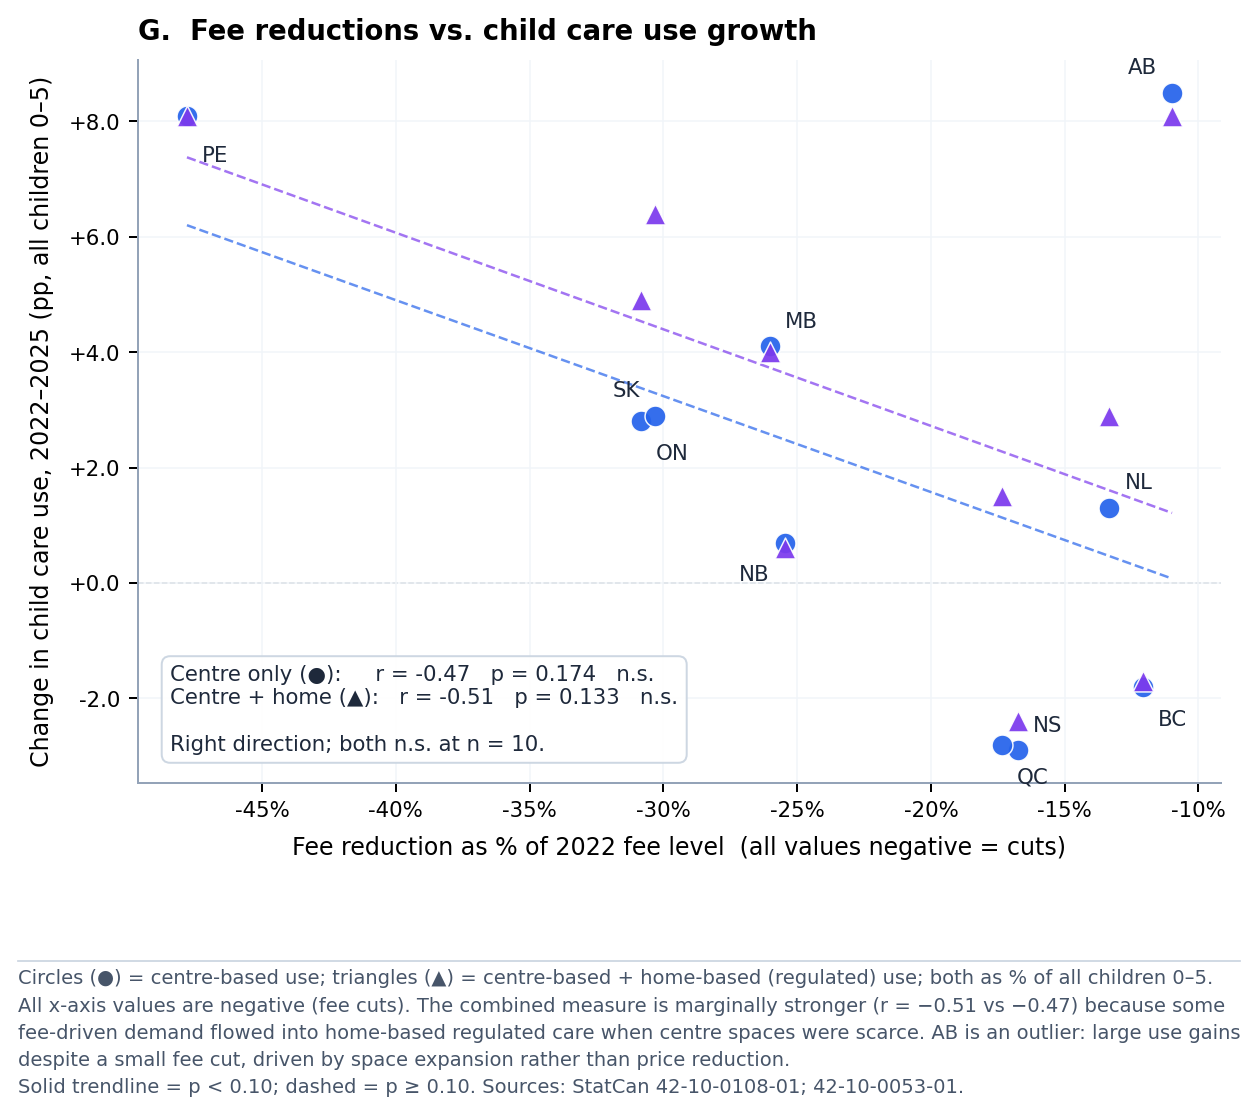
Figure 18: Fee Reductions vs. Difficulty Finding Child Care, 2022-2025
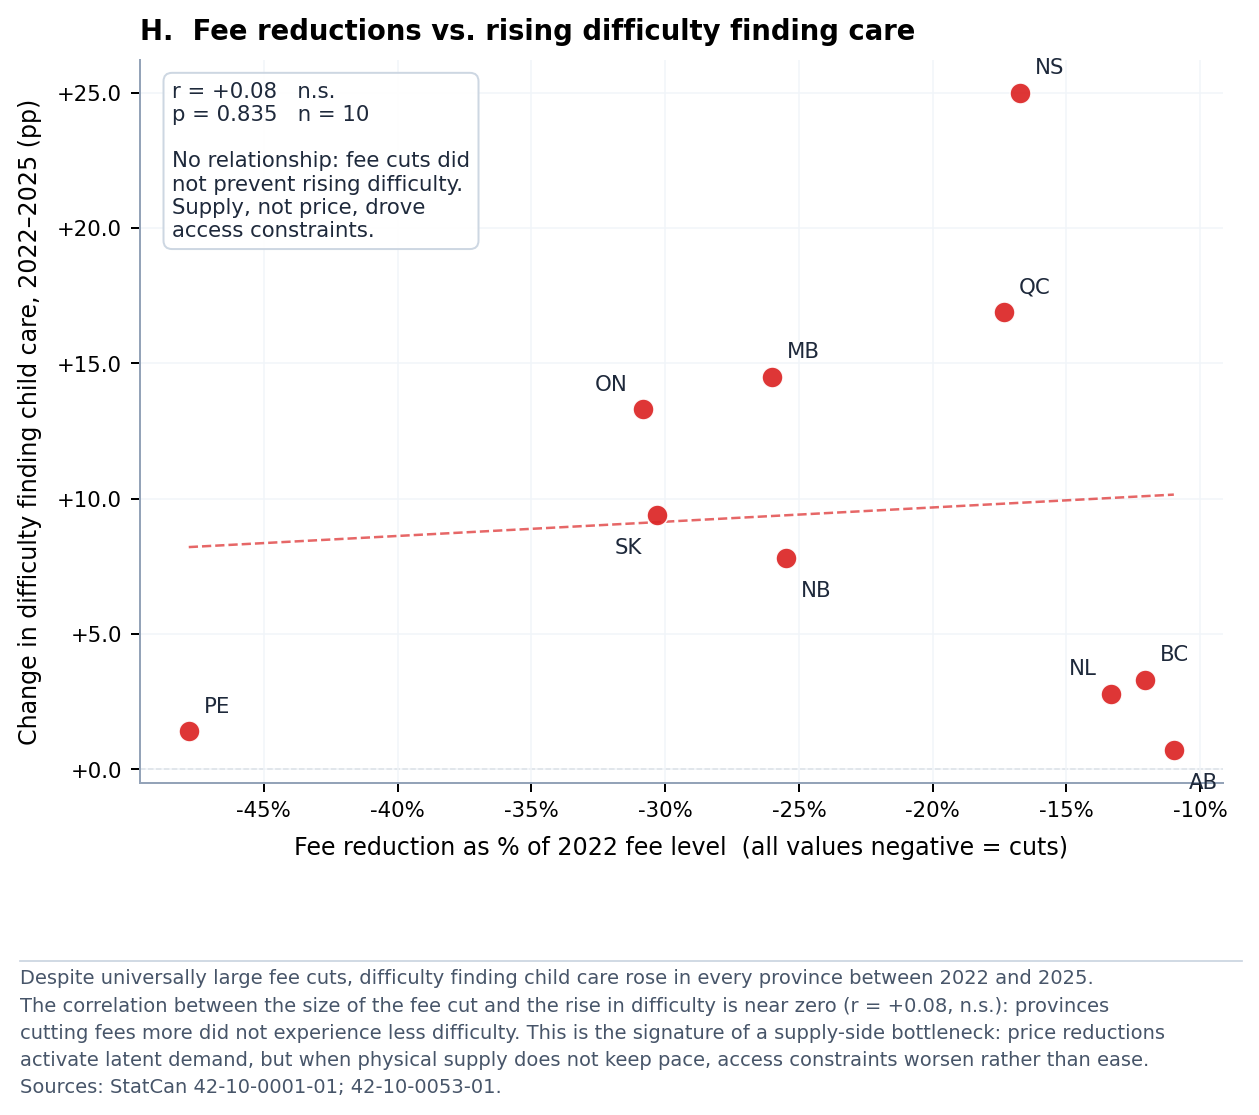
Figure 19 plots the change in reported difficulty against the change in centre-based use across provinces. The negative relationship is the clearest descriptive association in the cross-provincial analysis and constitutes the clearest signal of a bottleneck operating at the provincial level: where difficulty rose most sharply, uptake of centre-based care grew less or fell. Nova Scotia is the extreme case, with difficulty increasing by 25 percentage points and centre-based use declining by 2.9 percentage points over the same period. Quebec shows a similar pattern in the centre sector, though combined use (centre plus home-based) rose modestly as families shifted toward regulated home-based arrangements within a system where CPE capacity was also constrained.
Figure 19: Rising Difficulty vs. Child Care Use Growth, 2022-2025
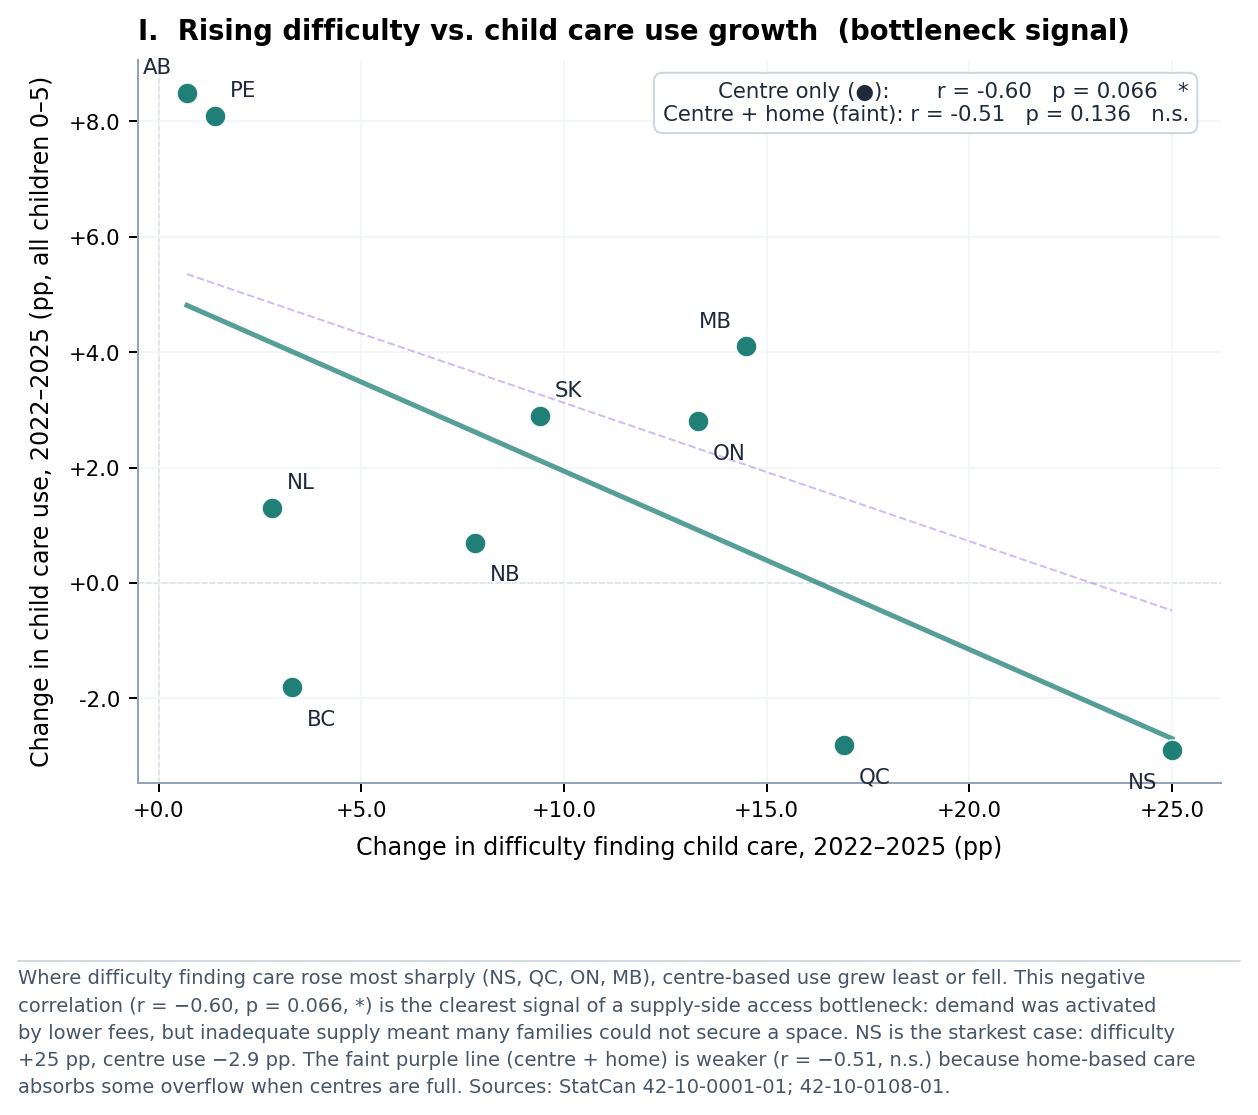
Figure 20 synthesizes these findings into a four-quadrant typology using median splits on both the difficulty-change and combined-use-change axes. Prince Edward Island and Alberta emerge as clear responders, translating affordability or space expansion into genuine uptake with manageable supply pressure. Ontario, Manitoba, and Saskatchewan fall into a demand-led strain category: use increased, but so did difficulty, indicating that supply is chasing demand rather than leading it. Nova Scotia and Quebec sit in the access bottleneck quadrant, where difficulty rose sharply but uptake did not follow. Newfoundland and Labrador, New Brunswick, and British Columbia show flat or declining use with stable difficulty, a pattern consistent with saturation or with other barriers, including remaining fee levels, workforce shortages, and pre-existing high rates of non-participation, constraining further gains independent of space availability.
Figure 20: Bottleneck Typology
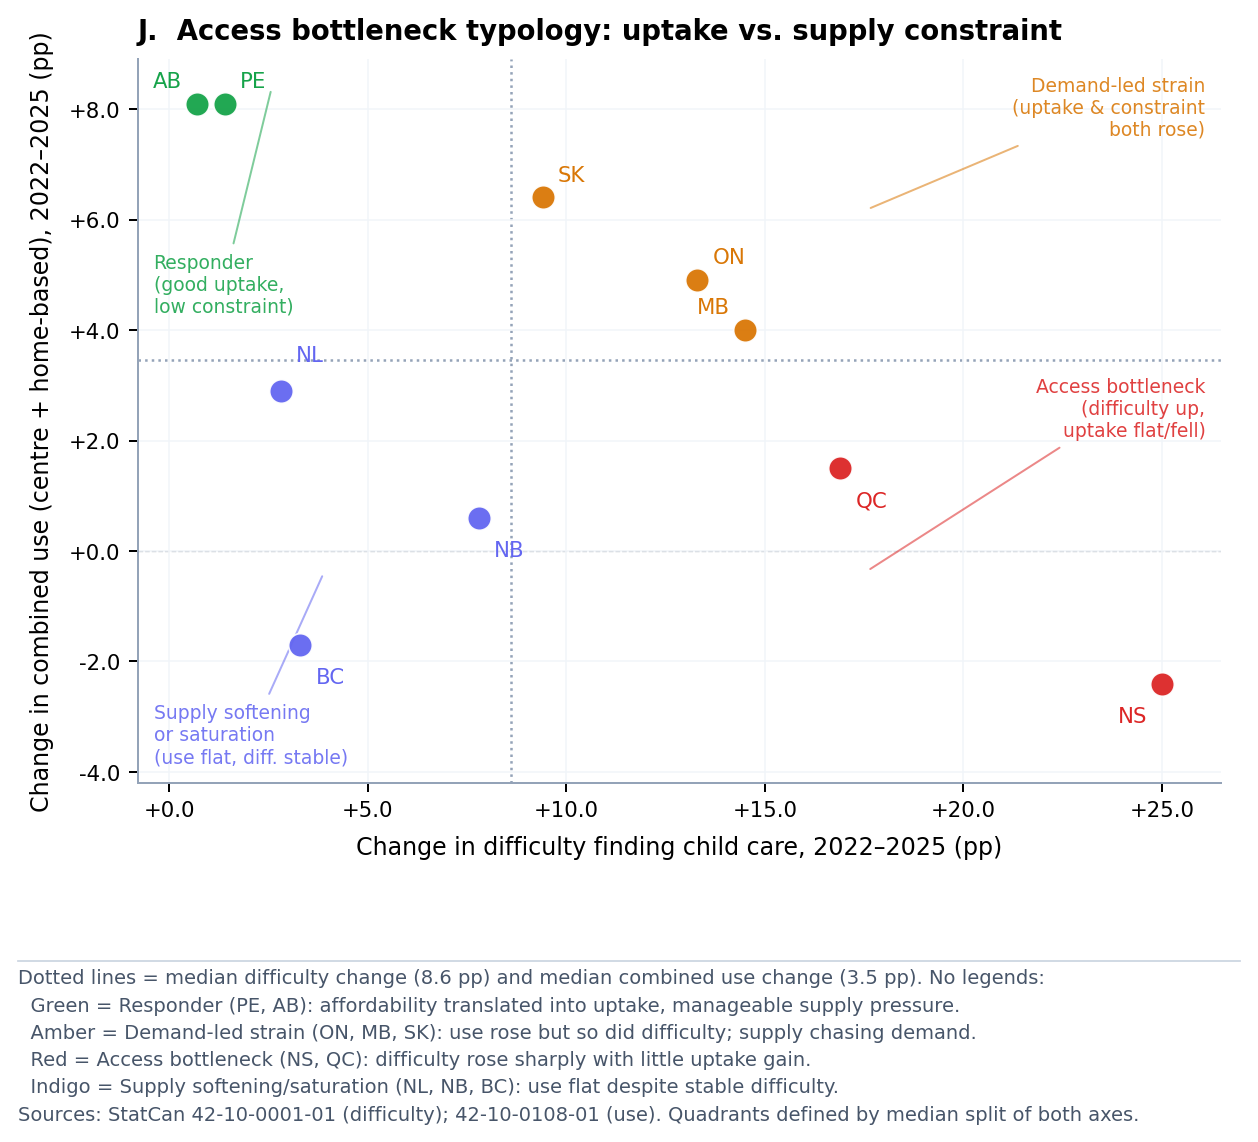
Note: Quadrant boundaries defined by the median of each axis across the ten provinces.
Implications for Equitable Access Across Various Demographic Groups
As illustrated in Figure 21, in 2025, 77.9 percent of children aged zero to five with an employed primary caregiver were in some form of child care arrangement, compared with only 34.7 percent of those with a non-employed caregiver, a gap of 43 percentage points that has remained broadly stable since 2019. For formal regulated care the picture is sharper still. Among children with an employed caregiver, 45.5 percent used centre-based care and 66.6 percent used centre-based or home-based care; for those with a non-employed caregiver the corresponding figures were 17.4 percent and 31.0 percent. Families outside the formal labour market, including parents on parental or maternity leave, those not in the labour force, and lower-income caregivers who cannot afford care even at reduced fees, remain substantially less connected to the regulated child care system and have therefore been less positioned to benefit from the affordability gains delivered under CWELCC.
Appendix Figure A4 shows the employment-linked gap in centre-or-home use is present in all provinces but the magnitude varies considerably. It was largest in Saskatchewan (54 percentage points in 2025), Alberta (50 points), and British Columbia (45 points), and narrowest in Quebec (21 points), consistent with Quebec’s longer history of near-universal coverage, which has progressively reduced the relationship between parental employment status and access to regulated care.
Figure 21: Child Care Use by Employment Status, Canada, 2019-2025
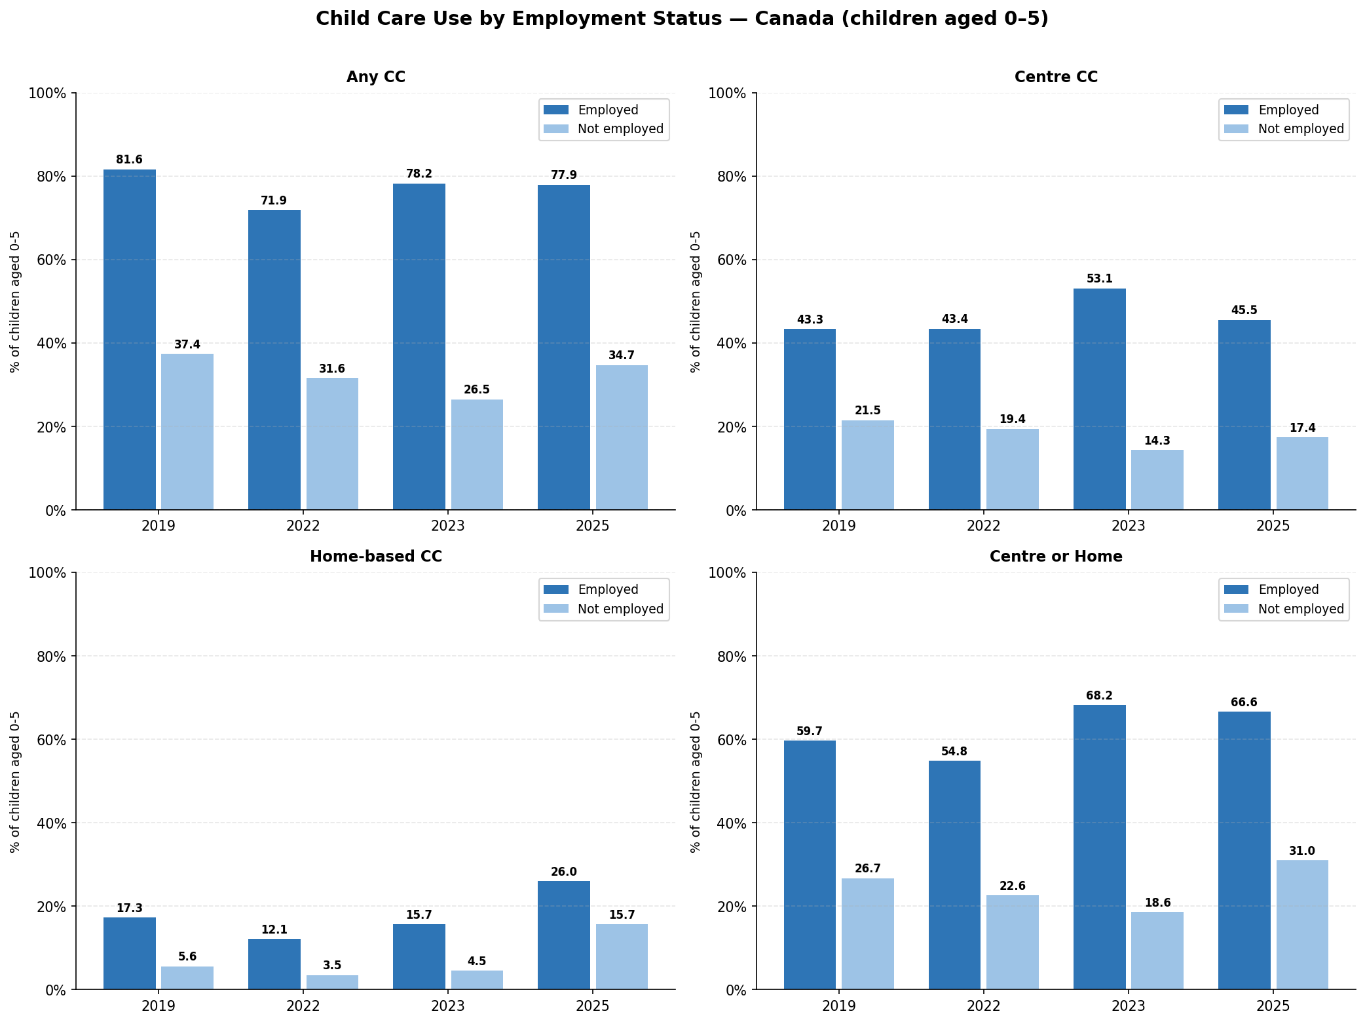
Source: CSLS calculations based on Statistics Canada Survey on Early Learning and Child Care Arrangements / Canadian Survey on Early Learning and Child Care microdata.
Education-linked disparities in child care use are equally persistent and have, if anything, widened slightly over the reform period (Figure 22). In 2025, 71.3 percent of children with a post-secondary-educated primary caregiver used any child care, compared with 46.1 percent of those whose caregiver had less than a high school diploma, a gap of 25 percentage points that has grown from 23 points in 2019.
The gradient is steeper for centre-based care, where postsecondary-educated caregivers report a rate of 43.1 percent against 23.1 percent for the lowest education group, a 20-point gap that was 17.5 points in 2019. Part of this reflects cost. Even at much lower fees, the remaining out-of-pocket expense absorbs a larger share of income for lower-earning families. But information barriers, proximity to regulated spaces, and uncertainty about eligibility also play a role. The persistence and mild widening of the education gap across four survey waves, spanning a period of substantial public investment in both affordability and supply, suggests price reductions alone have been insufficient to close the participation divide between more and less educated families.
Figure 22: Child Care Use by Education Level, Canada, 2019-2025
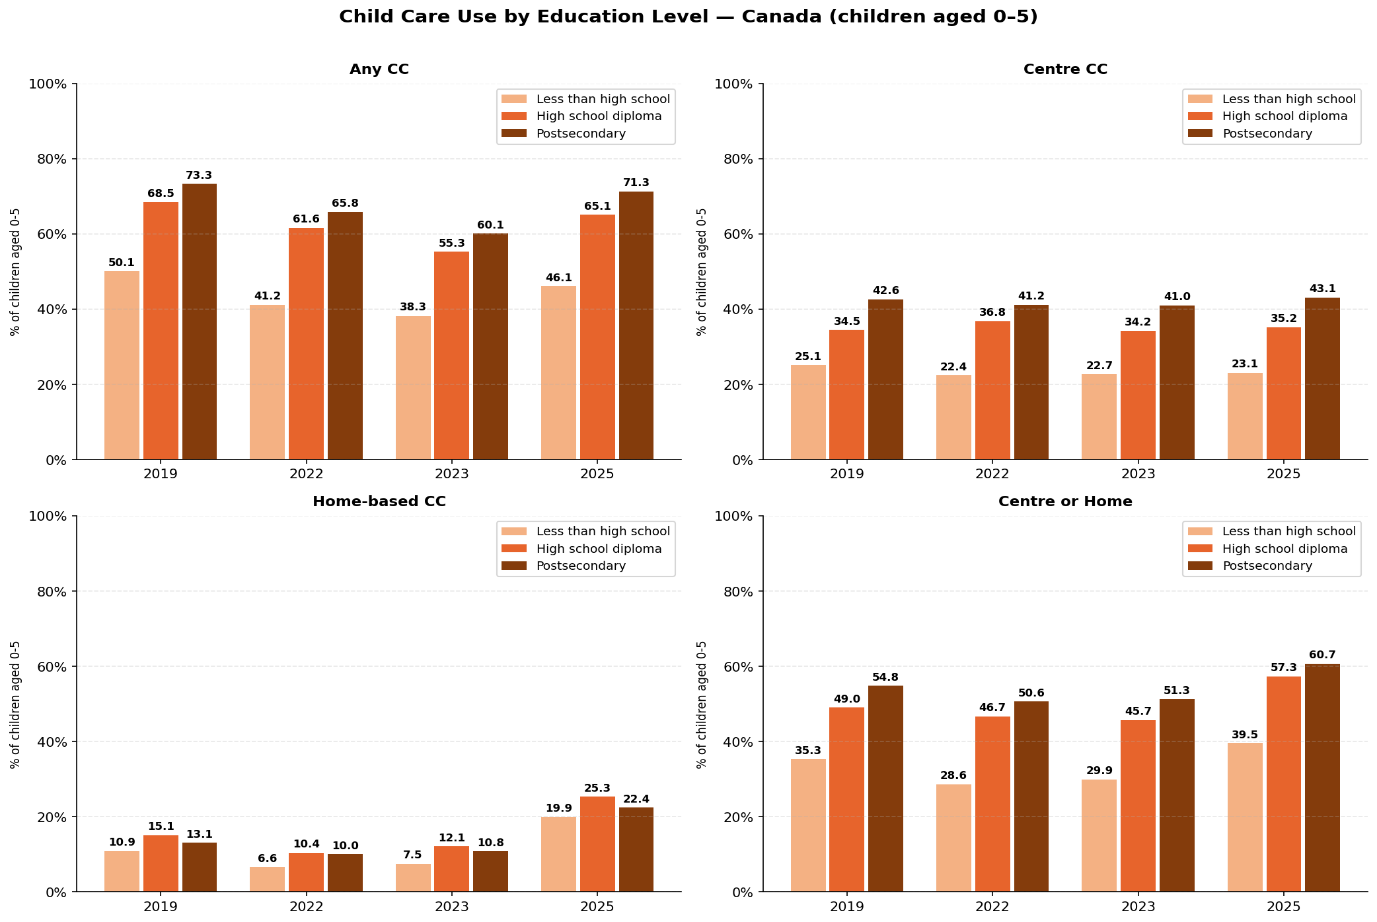
CSLS calculations based on Statistics Canada Survey on Early Learning and Child Care Arrangements / Canadian Survey on Early Learning and Child Care microdata
Immigrant families show a somewhat more encouraging trajectory over the same period according to Figure 23. In 2022, immigrant parents were 6 percentage points less likely than non-immigrants to use child care (53.7 versus 59.7 percent) and 3.8 points less likely to use centre-based care. By 2025, both gaps had narrowed substantially. That said, the immigration variable is not defined identically across survey years, capturing the respondent’s own status in 2022, the household’s status in 2023, and the child’s status in 2025, so some of the apparent narrowing may reflect measurement change rather than solely a behavioural shift.
What the demographic evidence as a whole makes clear is that affordability reform is a necessary but not sufficient condition for equitable access. Reaching lower-income, lower-education, non-employed, and some newcomer families will require complementary action on outreach, targeted subsidies, and the location of new spaces in communities where these groups are concentrated. Without it, the system risks reinforcing a pattern in which the economic and developmental benefits of regulated child care flow disproportionately to families already well positioned to take advantage of them.
Figure 23: Child Care Use by Immigration Status, Canada, 2019-2025
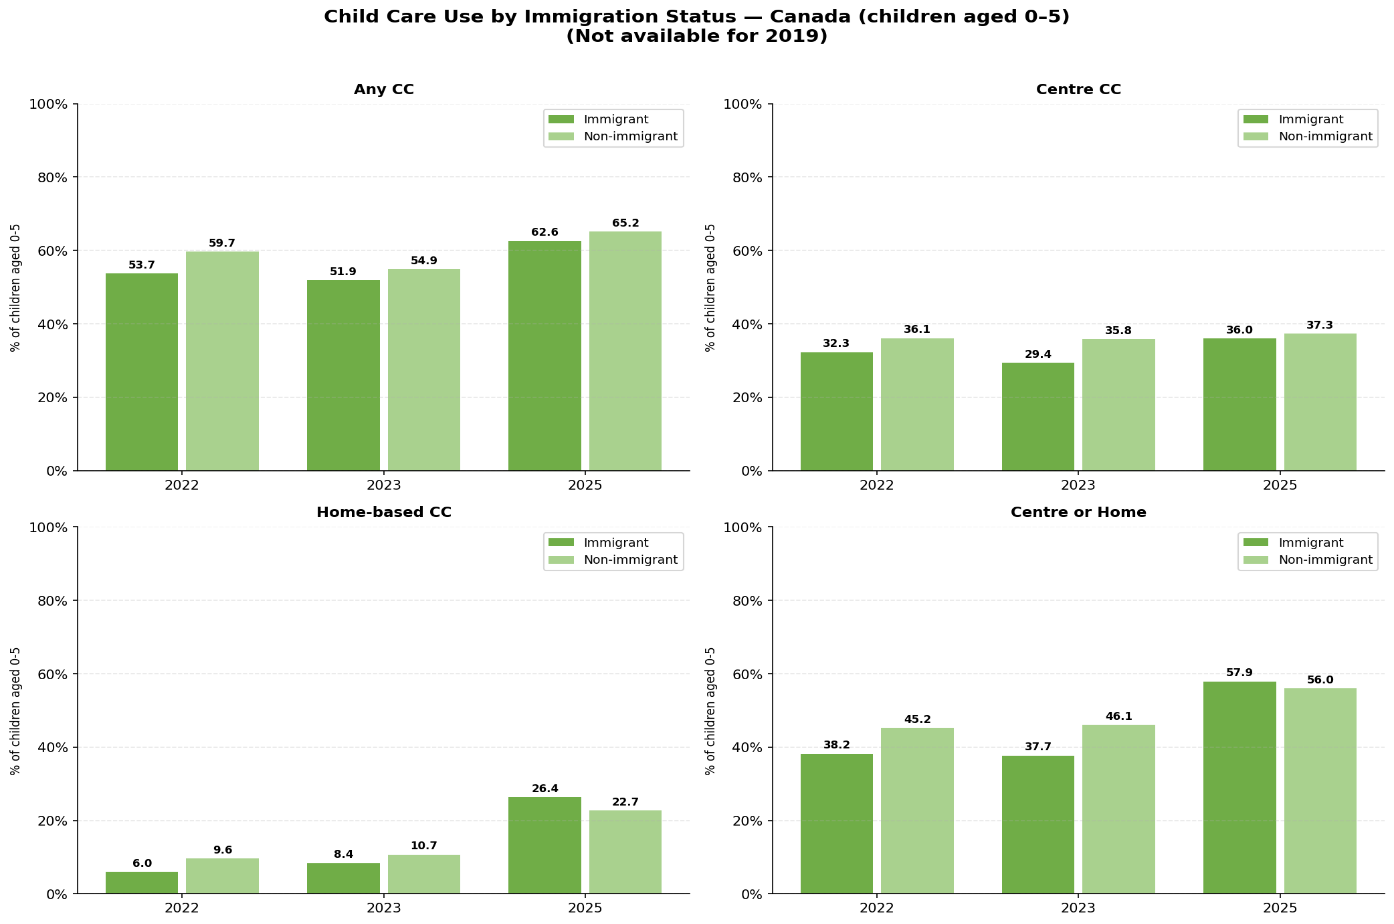
Source: CSLS calculations based on Statistics Canada Survey on Early Learning and Child Care Arrangements / Canadian Survey on Early Learning and Child Care microdata
Policy Insights for Sustaining and Scaling the $10-a-day Plan
The emerging evidence suggests that the next phase of child care policy must move beyond affordability alone and focus on the conditions required for affordability to translate into real access. Lower fees have increased demand, but the supply of staffed spaces has not expanded quickly enough to keep pace. As a result, the central policy bottleneck has shifted from price to capacity.
This makes workforce policy a central part of child care system design rather than a peripheral labour-market issue. A substantial wage enhancement for qualified early childhood educators should be understood not as a stand-alone fix, but as an enabling condition for converting fee reductions into staffed spaces and, in turn, into larger labour-market and economic returns. The case for this is strengthened by evidence that higher compensation can improve recruitment and retention, while still requiring complementary investments in physical capacity and training to support durable expansion (Shariati, 2024). More broadly, strengthening the workforce also means improving benefits, pensions, paid leave, job quality, and professional development.
Workforce investment, however, must be paired with more targeted space creation. Policy success should not be judged only by average fees, but also by who obtains a space, where new spaces are created, and whether lower-income and otherwise underserved families can maintain access as system rules change. This points to the need to direct new staffed spaces toward regions and populations facing the greatest barriers, including lower-income, lone-parent, newcomer, and rural families.
It also suggests that flexibility matters more than national discussions often acknowledge. For many families, especially those working non-standard hours, the binding constraint is not only whether care is cheaper, but whether care exists in a form and at times they can actually use. Canadian evidence indicates that families with non-standard schedules face particular difficulty securing stable care, while flexible and non-standard-hours provision remains limited; recent national policy analysis similarly suggests that, as affordability has improved, availability and flexibility have become more salient constraints for many households (Lero et al., 2021; Richardson, Prentice, and Lero, 2021; Mahboubi and Zhang, 2026).
Expansion strategy therefore matters as much as expansion itself. Recent Canadian evidence suggests that rapid growth without clear conditions can deepen inequities or weaken quality. The findings at both the federal and provincial levels point to persistent shortfalls in access and inclusion, while other recent work has raised concerns about the growing role of for-profit expansion and its implications for quality and public accountability (Auditor General of Ontario, 2025; Auditor General of Canada, 2025; Macdonald, 2025). The policy implication is not that expansion should slow, but that public funding should be tied more explicitly to public objectives such as staffed-space creation, workforce stability, quality assurance, and equitable access.
Conclusion and Policy Recommendations
This paper argues that the early phase of Canada’s $10-a-day child care reform has already produced meaningful economic gains, but that these gains remain incomplete because affordability has improved faster than access. We show that parent fees have fallen sharply across the country, especially in centre-based care, and that maternal labour market outcomes have responded accordingly. Using a difference-in-differences framework with three complementary comparison groups, we document robust positive effects on mothers’ employment and labour force participation, with the baseline estimates implying a 1.92 percentage point increase in employment and a 2.44 percentage point increase in labour force participation, effects that survive the exclusion of Quebec, the removal of the most disrupted pandemic months, the inclusion of province-by-month fixed effects, and checks for the influence of remote work. These gains translate into an estimated direct GDP effect of about $2.7 billion per year, with a plausible range of roughly $2 billion to $4 billion, and meaningful short-run fiscal returns. The increase in hours worked among already-employed mothers is positive but less robust, so it is reported as an upper bound rather than part of the headline. However, a large share of the potential return remains unrealized because space creation has not kept pace with demand, waitlists have lengthened, and the early childhood workforce remains a binding bottleneck. The central message is that CWELCC has already generated real returns, but that unlocking the full return now depends on expanding staffed spaces, stabilizing the workforce, and improving equitable access.
This study points naturally toward several next steps for research. One priority is to go beyond affordability and labour supply and examine perceived quality of care more directly, including parental satisfaction and provider-level indicators of staffing, training, and service quality. A second is to study the distributional effects of CWELCC more systematically: if the policy is universal in design, how universal is it in practice. Our analysis suggests that lower-income, less educated, and non-employed families remain less connected to regulated care, making this an especially important question. A third avenue is comparative work that places Canada’s experience alongside jurisdictions with mature universal child care systems, both within Canada through Quebec and internationally through countries with longer-established public systems, in order to better understand what distinguishes the transition phase from a more mature equilibrium. Finally, future research should examine children’s outcomes more directly, especially behavioural and developmental effects, building on the Quebec literature associated with Baker, Gruber, and Milligan. That would help connect the paper’s current focus on maternal labour supply and economic returns to the broader social return on universal child care, including the conditions under which expansion improves both parental employment and child well-being.
Supplementary Material
Appendix A. Sample Construction and Variable Definitions
The LFS provides nationally representative information on labour force participation, employment, unemployment, and usual weekly hours of work, together with demographic characteristics and the age of children in the household.
The estimation sample is built from pooled monthly LFS Public Use Microdata Files. Respondents are restricted to adults under age 54 with own children in the household. A “young child” indicator identifies parents whose youngest child is under age six, while an “older child” indicator identifies parents whose youngest child is aged 6 to 12. Separate indicators are defined for mothers and fathers. Labour market outcomes include indicators for employment, labour force participation, and unemployment, along with usual weekly hours of work. The analysis uses both conditional hours and an unconditional hours measure, where hours are set to zero for non-employed respondents. All regressions use the LFS final survey weights.
Appendix B. Treatment Timing and Event-study Specification
For the within-province specifications, treatment timing is defined using province-specific CWELCC implementation dates. The post-treatment indicator equals one once the survey month is at or after the first CWELCC agreement month for that province. In the Quebec benchmark specification, a common post period beginning in July 2021 is used instead, reflecting the start of the national CWELCC rollout while preserving identification in the non-Quebec versus Quebec comparison.
To assess pre-trends and trace the evolution of treatment effects over time, the paper also estimates event-study models of the form:

where measures time relative to the province-specific CWELCC implementation month and the omitted category is the month immediately before treatment. The coefficients on the lead terms provide a direct check on the parallel-trends assumption, while the lag terms show how treatment effects evolve after implementation.
In Figure A1, each panel plots the coefficient on the interaction of treatment-group status with months relative to the provincial agreement-signing month, with the month before signing omitted as the reference period; shaded bands are 95 percent confidence intervals.
Figure A1: Event-study estimates of the effect of CWELCC on maternal labour market outcomes, Designs 1 and 2
Panel A: Design 1, Labour force participation
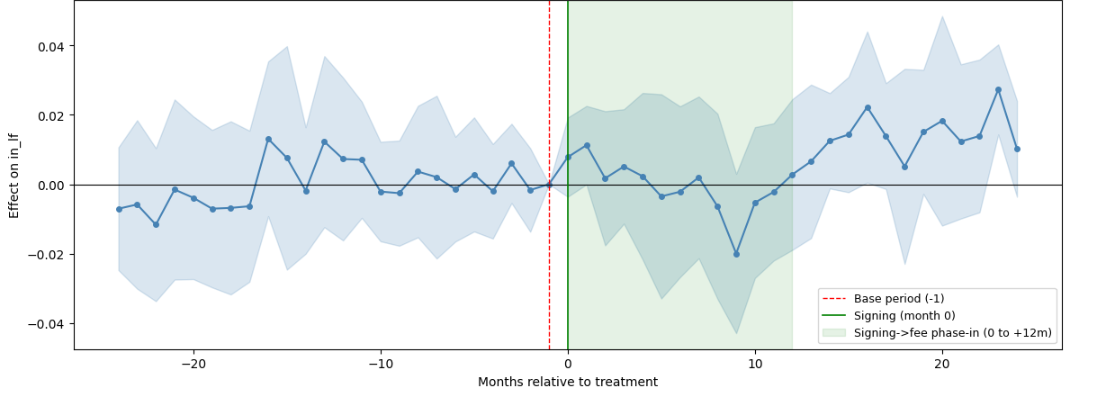
Panel B: Design 1, Employment
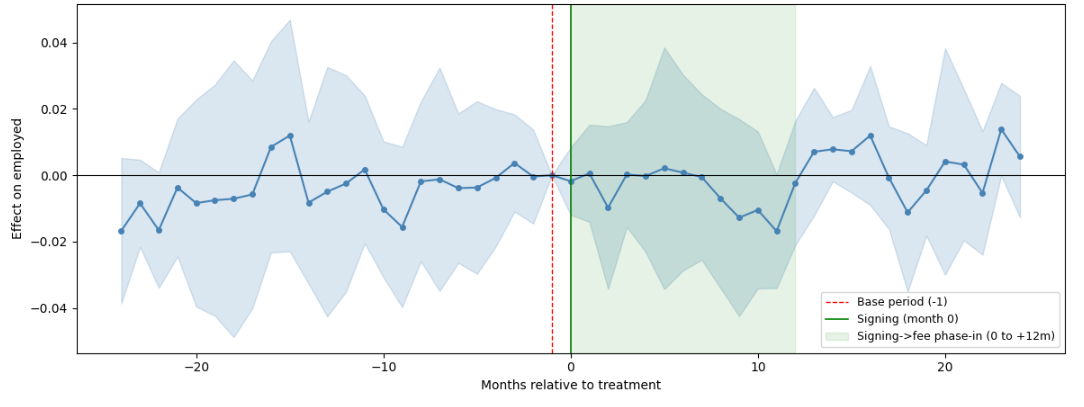
Panel C: Design 2, Labour force participation
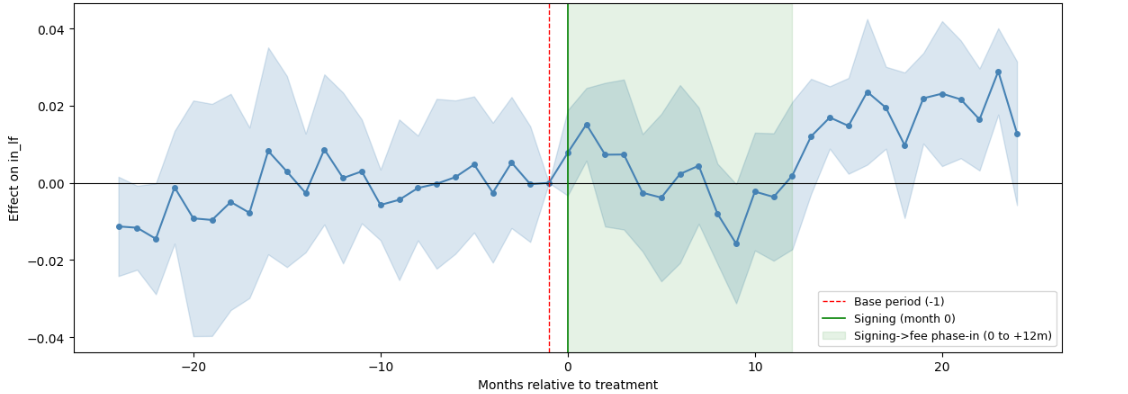
Panel D: Design 2, Employment
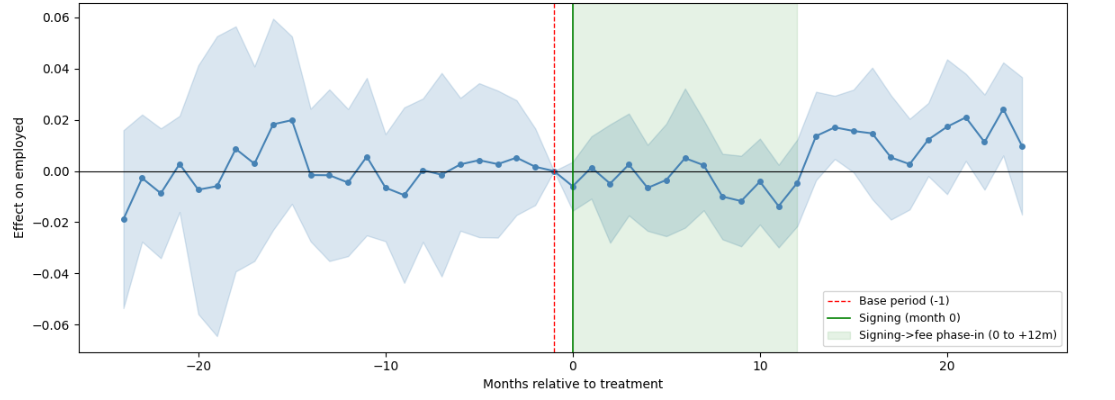
Note: The lightly shaded vertical region marks months 0 to 12, the interval between agreement signing and the actual fee reductions; the data are consistent with effects emerging once fees fall rather than at the signing date. A joint pre-trend test is not reported because the number of lead coefficients exceeds the number of provincial clusters minus one, so pre-trends are assessed visually and corroborated by the placebo and clean-window trend tests in Appendix C.
Source: CSLS calculations based on the Labour Force Survey Public Use Microdata Files, 2015 to 2025.
Appendix C. Inference and Robustness
All models are estimated by weighted least squares using the Labour Force Survey final weights, with fixed effects for province, year-by-month, and province-by-treatment-group, and the demographic controls. Standard errors are clustered by province. Because there are only about ten provincial clusters, every within-province coefficient is also evaluated with a wild cluster bootstrap using Webb weights and 399 replications. Design 3 has a single control cluster (Quebec) and its standard errors are reported as indicative only. Table A1 collects these coefficients for the within-province designs across the main robustness specifications.
We estimate event-study versions of the within-province designs, interacting indicators for months relative to treatment with the treated-group indicator and omitting the month before treatment. The lead coefficients are scattered around zero with no pronounced pre-trend, and the lag coefficients are near zero through roughly the first year after signing and then rise. Because agreements were signed in 2021 and 2022 but fees fell on a lag, an effect that emerges about a year after signing, when fees actually dropped, is consistent with a child care mechanism rather than a coincident shock at the signing date.
The main specifications include controls for age group, marital status, education, immigrant status, census metropolitan area status, province fixed effects, and year and month fixed effects. A post-COVID indicator is also included to absorb the broad shift in labour market conditions after the onset of the pandemic period. For the conditional hours regressions only, additional controls for union status, occupation, and industry are included, since these are observed only for employed individuals. These job-level controls are excluded from employment and participation regressions to avoid conditioning on labour market outcomes that are themselves potentially affected by the policy.
Placebo test. Using only pre-treatment data, we assign a fake treatment date and re-estimate. A clean pre-pandemic placebo (data through February 2020, fake date January 2018) returns a small, insignificant coefficient for Design 1 and a marginal one for Design 2, indicating approximately parallel pre-trends in normal times. Placebos set in the immediate run-up to the 2021 signings do fire, but that window lies inside the pandemic dip and recovery and reflects differential COVID dynamics rather than a pre-existing policy trend.
Dropping Quebec. the one province with a mature pre-existing low-fee system, leaves the within-province effects intact and slightly larger (Design 1 employment 2.80 percentage points, participation 3.10 percentage points; Table A1), so the result is not an artifact of pooling a province whose post-2021 fee change was minimal.
COVID donut. Excluding the acute pandemic months from March 2020 to June 2021 leaves the effects essentially unchanged (Design 1 employment 2.26 percentage points, participation 2.83 percentage points; Table A1), so the result is not driven by the most disrupted labour-market period.
Adding a treated-specific linear trend fit over the full sample drives the effect to zero, but that slope is contaminated by the 2020 dip and 2021 recovery, which a straight line reads as a steep pre-trend. When the slope is instead estimated only on a clean window from January 2017 to February 2020, after the July 2016 Canada Child Benefit rollout and before the pandemic, and then projected forward, the differential pre-trend is essentially flat and the effect re-emerges (Design 1 employment about 1.5 percentage points; Design 2 participation about 1.2 percentage points; Table A1). The clean-window test is the more credible because the projected slope cannot be inflated by pandemic dynamics; it attenuates the estimate to the lower end of the plausible range without eliminating it.
Province-by-month fixed effects. Replacing the separate province and month fixed effects with province-by-month fixed effects absorbs every province-level shock, including differential pandemic recoveries, sectoral booms, and the uneven provincial rollout of remote work. The estimates are essentially unchanged from the main specification (Design 1 employment 1.92 percentage points, participation 2.43 percentage points; Table A1), so no province-level confound can account for the result.
The Canada Child Benefit is age-graded toward children under six and the 2021 Young Child Supplement was under-six-only, so both map onto the Design 1 split; the pre-trend window begins in 2017 to exclude the rollout, the level effect is absorbed by the fixed effects, and Designs 2 and 3 difference federal benefits out entirely.
Remote work expanded sharply after 2020 and could have raised participation more for mothers of young children. We address this through design: province-by-month fixed effects, which absorb any province-level remote-work rollout, leave the estimates unchanged; the Quebec benchmark nets out the nationwide shift to remote work while holding the presence of young children constant and remains positive; in Design 1 the effect is at least as large for mothers without a university degree (employment 1.71 versus 1.30 and participation 2.31 versus 1.65; Table A1), who hold less remote jobs; and a triple-difference that interacts the treatment with the work-from-home feasibility of a mother’s occupation finds the hours response, if anything, larger in occupations that cannot be done remotely.
The clean-window pre-trend test separates the two margins. The extensive-margin estimates attenuate but remain positive (Design 1 employment 1.51, Design 2 participation 1.23; Table A1), whereas unconditional hours do not survive, because mothers’ weekly hours were on a secular uptrend that the projection absorbs. We therefore report a robust extensive-margin effect and treat the hours channel as not separately identified, which is why the headline economic return is anchored on employment.
Appendix D. Alternative GDP Gains Estimates
To assess the robustness of the baseline GDP estimate, this appendix explores how the results vary under alternative assumptions about two key macroeconomic parameters: the employment attachment response and the GDP multiplier applied to labour income gains. While the baseline calculation translates the estimated change in employment directly into GDP using a labour share of 0.55, broader economic effects may be larger if additional employment generates spillovers through increased consumption, production linkages, and induced demand. At the same time, the strength of the employment response itself may vary depending on how fully newly employed mothers remain attached to the labour market over time.
The baseline figure is constructed as follows. Applying the Design 1 employment effect of 1.92 percentage points (0.0192) to the 2025 reference population of 1,530,286 mothers under age 54 with a youngest child under six gives about 29,000 additional employed mothers. Valuing each at the pre-treatment sample averages of 33.6 usual weekly hours and an hourly wage of $28.69, and treating the higher employment level as sustained across the year (52 weeks), yields about $1.47 billion in additional annual labour income (0.0192 × 1,530,286 × 33.6 × 52 × $28.69). Grossing this up by the inverse of a 0.55 labour share gives a direct GDP effect of about $2.68 billion per year ($1.47 billion ÷ 0.55). The scenarios in the remainder of this appendix vary the attachment factor and the GDP multiplier around this baseline.
The attachment factor captures this uncertainty on the labour supply side. It scales the estimated employment effect to reflect the possibility that not all newly employed individuals contribute a full year of work or remain continuously attached to employment. A value of 1.0 corresponds to the baseline assumption that the estimated employment increase translates fully into sustained employment over the year. Higher values, such as 1.2 or 1.4, reflect scenarios in which employment gains are stronger or more persistent than the baseline estimate suggests, either because participation responses intensify over time or because newly employed mothers accumulate more hours than initially observed. This parameter therefore captures uncertainty around the durability and intensity of the extensive-margin response.
The GDP multiplier captures broader general equilibrium effects beyond the direct contribution of additional labour input. A multiplier of 1.0 corresponds to the direct GDP effect only, while higher values such as 1.1 or 1.2 allow for indirect and induced effects as higher earnings translate into increased spending, business activity, and further employment. These multipliers are intentionally modest and reflect standard ranges used in applied policy analysis for labour supply–driven shocks, rather than large fiscal stimulus multipliers. These are scenario multipliers, not estimated general-equilibrium effects.
Figure A2 presents the sensitivity of the employment-anchored GDP estimate to two macroeconomic parameters: the labour-market attachment factor, which scales the reference-week employment response into a fuller annual measure of attachment, and a general-equilibrium multiplier applied to the additional labour income. Under the most conservative assumptions, with both parameters set to 1.0, the gain is the headline figure of about $2.68 billion, the direct effect of the increase in maternal employment. Holding the multiplier fixed, raising the attachment factor from 1.0 to 1.4 increases the estimate from about $2.68 billion to about $3.75 billion. Holding the attachment factor fixed, raising the multiplier from 1.0 to 1.2 increases the estimate from about $2.68 billion to about $3.22 billion. A central case, with an attachment factor of 1.2 and a multiplier of 1.1, gives about $3.54 billion, and the upper-bound scenario, with the attachment factor at 1.4 and the multiplier at 1.2, reaches about $4.50 billion.
These figures scale the robust employment channel only. The larger hours-inclusive calculation, which adds the change in hours worked among mothers already employed, would raise each value by roughly 18 percent (for example, the conservative case rises from about
Figure A2: Alternative GDP Gain Scenarios
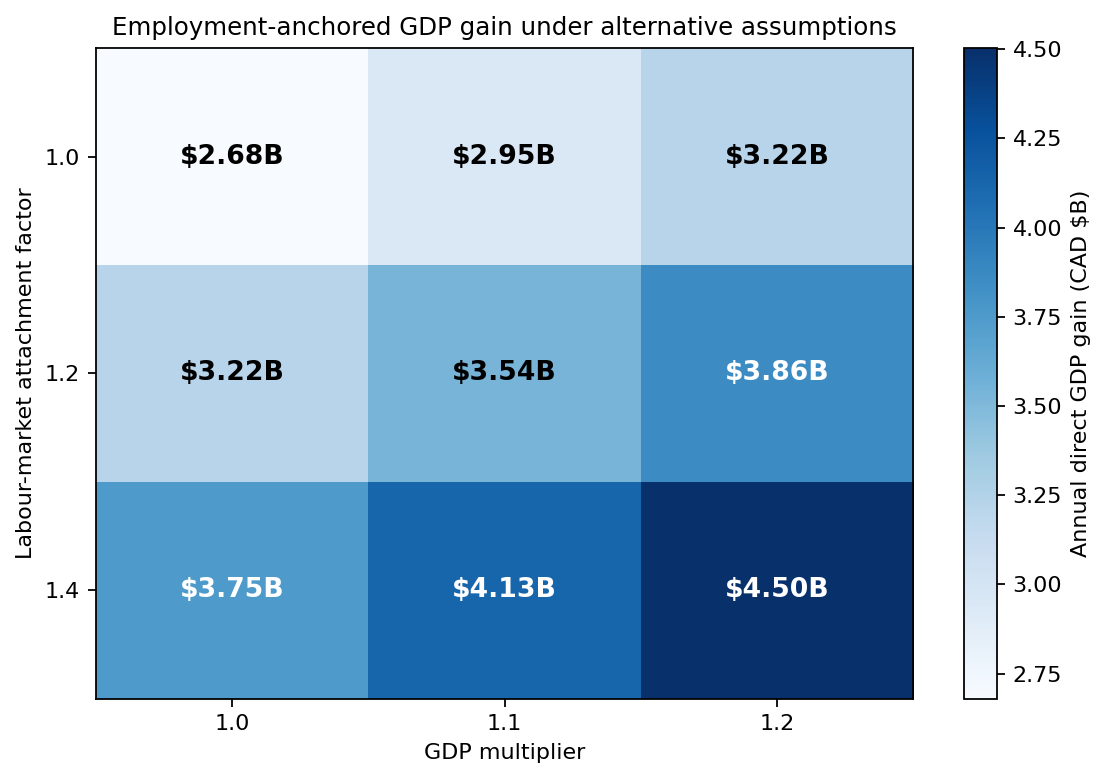
Source: CSLS Calculations
$2.68 billion to about $3.17 billion). Because the hours response does not survive the most demanding pre-trend specifications, we report the hours-inclusive figures as an upper bound rather than as the central estimate.
Appendix E. Sensitivity of Fiscal Offsets to Tax-Rate Assumptions
A useful robustness check is to vary the assumed effective tax and clawback rates. We report three scenarios. The low-tax case uses a 14.5 percent personal income tax rate, which corresponds roughly to the 2025 federal lowest bracket alone, a 7.7 percent payroll rate, which approximates employee-side CPP and EI contributions only, a 3.5 percent indirect tax rate, and a 1 percent transfer clawback. The baseline case uses the central values described above. The high-tax case uses a 20 percent personal income tax rate, retains the broader 15.6 percent payroll rate, applies a 6 percent indirect tax rate, and assumes a 5 percent transfer clawback. These alternatives span a reasonable range around current federal and payroll schedules and around cross-province GST/HST exposure (Canada Revenue Agency 2025a; Canada Revenue Agency 2025b; Canada Revenue Agency 2025c). At the baseline rates — a 17 percent personal income tax rate, 15.6 percent payroll contributions, a 4.8 percent indirect tax rate, and a 3 percent transfer clawback applied to the $1.47 billion labour-income gain — the four channels contribute about $250 million, $230 million, $71 million, and $44 million respectively, giving the $365 million core general-revenue offset and the $595 million broader public-finance offset reported in the main text.
Under the low-tax case, the direct labour-income gain of $1.47 billion yields a core general-revenue offset of $279 million per year and a broader public-finance offset of $393 million per year. Under the baseline case, the same quantities are $365 million and $595 million, respectively. Under the high-tax case, they rise to $456 million and $685 million. Applying the same tax-rate scenarios to the attachment-adjusted labour-income gain of $1.76 billion yields a range from $335 million to $547 million for the core general-revenue offset and $471 million to $822 million for the broader public-finance offset. These results indicate that the fiscal conclusion is not driven by a single tax-rate assumption: even under conservative rates, the increase in maternal labour supply generates a substantial annual fiscal offset.
The use of an effective indirect-tax parameter also reflects the broader consumption literature, which shows that household spending responds to income changes but generally not one-for-one, and that the marginal propensity to consume varies across contexts and households (Jappelli and Pistaferri 2010). The effective indirect-tax assumption used here should therefore be understood as a central scenario rather than a directly estimated behavioural parameter.
Appendix F. Child Care Use Patterns
Prince Edward Island, Alberta, and Manitoba recorded the clearest increases in the share of users in centre-based care over this period, while Quebec stands out for a noticeable decline, from 68.6 percent to 60.1 percent. Figure A3, Panel B and C show the corresponding rise in home-based care. Nationally, the share of all children aged 0 to 5 in home-based child care increased from 15.7 percent to 17.3 percent, with the largest increases in Quebec, Saskatchewan, and Newfoundland and Labrador. Among children already using child care, the home-based share also rose nationally, from 8.1 percent to 10.0 percent, again with especially large increases in Quebec and Saskatchewan.
Simultaneously, some provinces moved in the opposite direction. Alberta recorded a clear decline in the share of all children in home-based care, and Prince Edward Island also declined on that measure, which is consistent with the stronger centre-based expansion observed in those provinces. This suggests that the post-2022 period has been characterized by two simultaneous trends: continued expansion of centre-based capacity in a number of provinces, and a shift in the composition of child care arrangements toward a larger role for home-based care among users in some jurisdictions. This represents a compositional change and not that centre-based care declined in absolute terms.
Figure A4: Centre or Home-based Child Care, Employed vs. Non-employed, Children 0-5 (weighted)
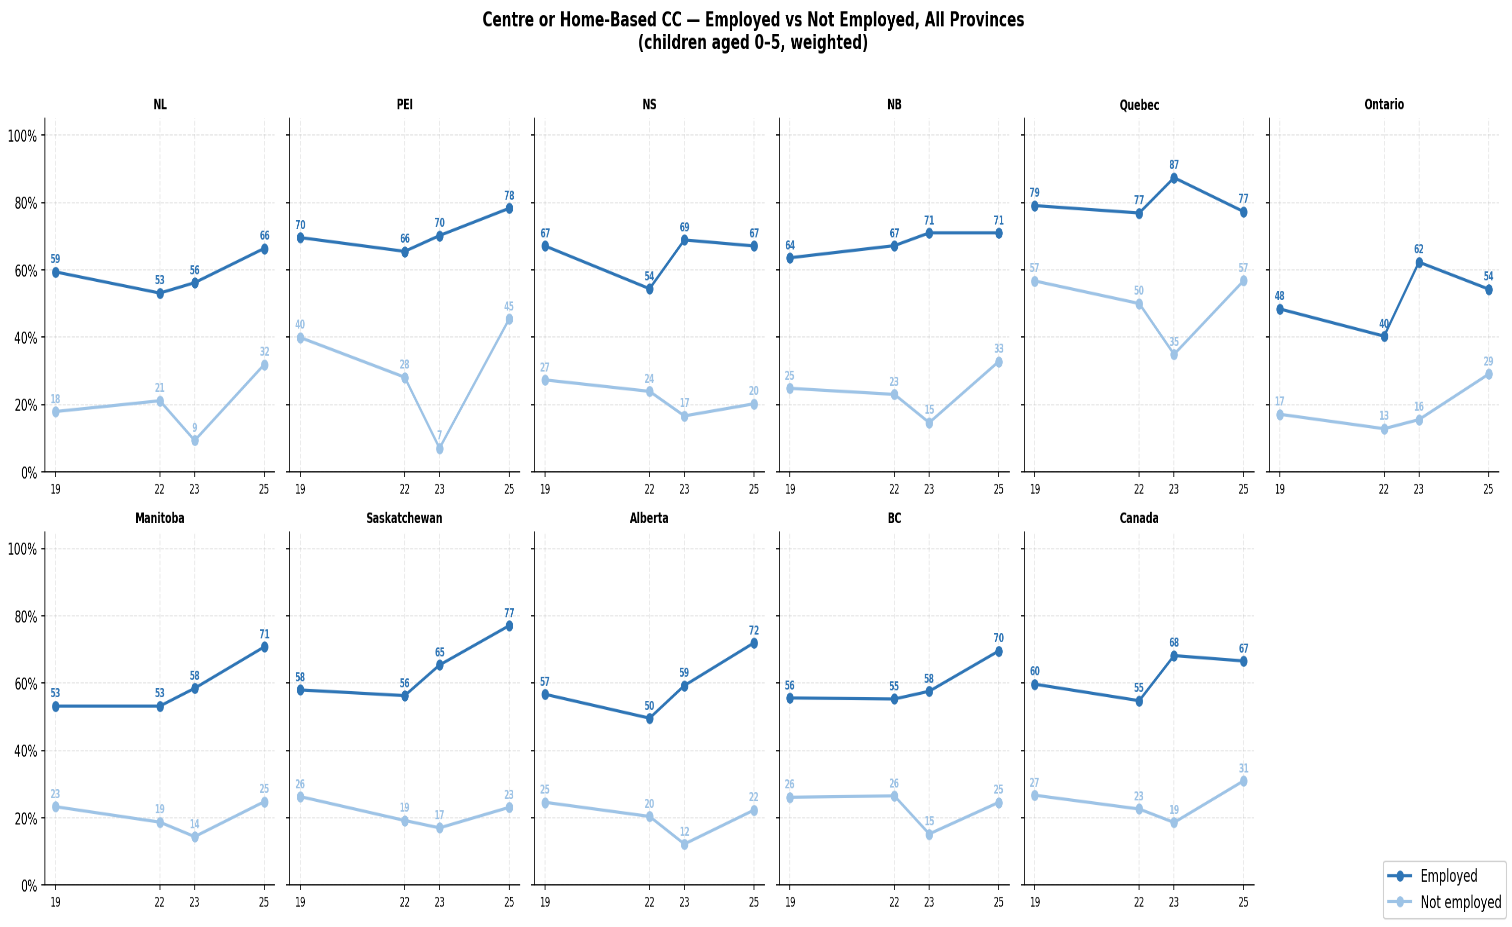
Appendix G. Consequences of Difficulties Accessing Child Care
These access problems have considerable implications for families’ labour market choices. Among children already using child care, Figure A6 shows that the share of parents and guardians who reported working fewer hours because of difficulties finding a suitable arrangement fell nationally from 36.6 percent in 2022 to 33.2 percent in 2025. This suggests some improvement at the intensive margin once families are at least partially connected to the system. However, other consequences moved in the opposite direction. The share reporting that they had postponed their return to work rose from 28.6 percent to 33.9 percent, while the share reporting that they had changed jobs, quit a job, or closed a business was broadly unchanged at around 14 percent.18
For families not using child care, the labour market consequences are even more concentrated around delayed work entry. Figure A6 shows that among parents and guardians facing difficulties and not using child care, the share reporting that they had postponed their return to work remained extremely high, increasing slightly from 42.0 percent in 2022 to 43.0 percent in 2025. By 2025, the highest levels were in Quebec at 51.1 percent, Newfoundland and Labrador at 46.1 percent, Ontario at 45.3 percent, and Saskatchewan at 44.5 percent. By contrast, the share reporting fewer hours worked declined nationally from 34.3 percent to 31.1 percent, and the share reporting that they had changed jobs, quit, or closed a business was essentially stable, edging down from 19.1 percent to 18.7 percent.19The broad interpretation is that for families outside the system, the main economic cost of limited child care access is not reduced hours in an existing job, but delayed labour market attachment altogether.
Appendix H. Parental Fees
Appendix Figure A7 provides a more detailed breakdown of changes in parental child care expenses across provinces and by type of arrangement between 2022 and 2025.
Consistent with the main results and as shown in Panel A, total child care expenses declined across all provinces, with the largest reductions observed in Ontario, Prince Edward Island, and New Brunswick. In Ontario, average annual expenses fell from about $8,500 to $5,900, representing the largest absolute decline, while Prince Edward Island experienced the steepest proportional reduction, with costs falling by nearly half. These broad-based declines confirm that CWELCC has significantly reduced out-of-pocket costs for families across the country, although the magnitude of the gains varies depending on provincial policy design and initial fee levels.
Panel C: Home-Based Child Care Providers
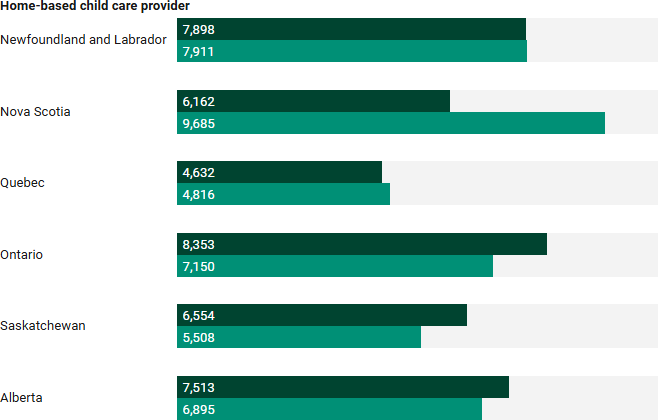
The disaggregated figures in Panel B highlight important differences across types of care. Centre-based child care saw the most substantial reductions, with Ontario recording a drop of more than $4,000 annually and Saskatchewan experiencing a near halving of costs, declining by over $3,300. Alberta and Manitoba also posted large reductions exceeding $2,000. By contrast, Panel C shows that trends in home-based child care were more mixed. Expenses increased in Nova Scotia, Newfoundland and Labrador, and Quebec, while declining in Ontario, Saskatchewan, and Alberta. This divergence likely reflects the stronger and more direct targeting of CWELCC funding toward regulated centre-based care, alongside differences in how provinces integrate or subsidize home-based providers. Overall, the figures reinforce that affordability gains have been largest and most consistent in the parts of the system most directly covered by CWELCC, while other segments have seen more uneven changes.
Notes
- Unfortunately, there is no single, universally accepted estimate of the number of spaces created under the first 5 years of CWELCC. ESDC (2026) estimates are current only to March 2025, and several provincial and territorial figures remain incomplete or marked “TBC.” Macdonald (2026) includes some spaces outside the CWELCC system. For transparency, we report all estimates we were able to identify. In addition, these counts are not directly comparable: the Auditor General, ESDC, and CCPA use different reporting dates, coverage, and definitions, so they should be read as a progression of estimates rather than as measures of the same quantity. Back
- Following CCPA’s CLAR-based definition, a child care desert is a local area where there are fewer than three licensed spaces per 10 non-school-age children nearby, after adjusting for the overlapping needs of children in surrounding areas. Back
- There is no indication in the Auditor General of Ontario report that lower-income families stopped using subsidies because childcare fees became affordable. If families were leaving subsidy because they could now afford child care, we would expect: 1) stable or rising enrolment among lower-income families; 2f Fewer subsidy claims but similar child care participation. The report shows the opposite: overall enrolment among subsidy families has declined, and demand pressures are increasing waitlists. Back
- In Statistics Canada’s CPI representative product list, the child-care-related items listed under “Household operations, furnishings and equipment” are “Babysitting service” and “Daycare centres.” These categories are not published with an age breakdown, so the CPI child-care services component cannot be mapped precisely onto the population covered by CWELCC. However, because CWELCC fee reductions primarily apply to children under age six in participating licensed child-care programs, and because we are not aware of comparable policy changes during this period affecting older children’s care fees, it is plausible that much of the observed CPI decline in child-care services reflects CWELCC-related fee reductions. Back
- These two views of the same trend matter because they capture different dimensions of system growth. Percentage changes tell us where expansion has been most rapid relative to the size of the pre-existing system. Absolute changes show where the largest number of new spaces has actually been added. Taken together, the figure suggests that space creation has been real and significant, but not evenly distributed. Some smaller provinces expanded quickly from a lower base, while larger provinces added large numbers of spaces without necessarily posting the fastest growth rates. Quebec is a good example of this pattern. Its percentage growth is more modest, but that reflects the fact that it was already starting from a much higher level of coverage. Back
- We note that early childhood educators (ECEs) are typically staff with formal child care qualifications, although minimum qualification requirements vary across jurisdictions. Early childhood educator assistants generally have limited or no formal child care qualifications. The data presented in this section on ECEAs, based on NOC code 42202, captures both ECEs and assistants. As a result, we are not able to report on their labour market conditions separately. Home child care providers, classified under NOC 44100, are a separate category. This group includes individuals who provide care primarily in their own homes or in children’s homes, where they may also reside. They may be employed by private households or child care agencies, or they may be self-employed. For the purposes of this report, we focus primarily on ECEAs, as they are the backbone of the regulated child care system. We acknowledge, however, that due to data limitations, we are not able to isolate qualified ECEs on their own. Back
- Real offered wages were calculated using the CPI estimates produced for provinces and territories available at https://www150.statcan.gc.ca/t1/tbl1/en/tv.action?pid=1810000401 Back
- The negative growth in PEI could be an artifact of data availability (up to Q2 2025) or the higher level of wages offered in the province. Back
- This is consistent with evidence showing that staff education, wages, and job quality are important predictors of child care quality, and that workforce strain is especially acute in positions requiring ECE training (Goelman et al., 2006; Charters and Findlay, 2024) Back
- In the specification comparing mothers whose youngest child is under age six with mothers whose youngest child is aged 6–12, the control group may include some partially exposed cohorts as the CWELCC rollout progresses, since some children aged 6–12 in later years may have previously been eligible for lower-fee care. Because the Labour Force Survey public use microdata file reports only broad youngest-child age groups, this contamination cannot be fully removed. For this reason, this specification is supplemented by the mother-versus-father and Quebec comparison designs. Back
- Because this design compares mothers and fathers within the same household type, it also nets out federal child benefits and any household-level shock common to families with young children, which makes it our most demanding identification and a useful check against confounding from factors that coincided with the reform. Back
- Because the number of provincial clusters is small, the statistical confidence interval around the central figure is wide, and we therefore present the result as a range rather than a single point. Back
- This is anchored to the fact that the federal lowest personal income tax rate for 2025 is 14.5 percent on a full-year basis, after the mid-year reduction from 15 percent, with provincial income taxes applying on top of that. The 17 percent value is therefore intended as a conservative effective combined rate rather than a statutory marginal rate (Canada Revenue Agency 2025a). Back
- This is anchored to the 2025 CPP employee and employer rate of 5.95 percent each, together with 2025 EI rates of 1.64 percent for employees and 1.4 times that amount for employers outside Quebec; Quebec EI premiums are lower at 1.31 percent for employees, so the assumed 15.6 percent rate is a reasonable Canada-wide combined approximation for employee-plus-employer payroll contributions on incremental earnings below the upper CPP2 range (Canada Revenue Agency 2025b). Back
- This is conservative relative to the structure of major income-tested benefits. For example, the Canada Child Benefit begins to phase down when adjusted family net income exceeds $37,487, with the reduction rate depending on the number of children (Canada Revenue Agency 2025d). The 3 percent rate used here is therefore intended as a reduced-form average across families rather than a statutory clawback rate. Back
- Source: Statistics Canada Table 42-10-0009-01. Back
- This is a conservative behavioural discount that accounts for labour market absorption limits, individual heterogeneity in employment intentions, and the fact that some parents who report postponing return to work face other barriers beyond child care. Back
- The provincial patterns are revealing. British Columbia stood out in 2025 for the highest share of current child care users reporting fewer hours worked, at 47.6 percent. Quebec recorded one of the largest increases in postponing return to work, rising to 38.1 percent, while New Brunswick also rose sharply to 36.7 percent. Alberta moved in the opposite direction on both margins, with large declines in reported work-hour reductions and postponed returns. These patterns suggest that, even among families already using child care, difficulties in finding the right arrangement continue to shape labour supply decisions, particularly by delaying re-entry or limiting the ability to increase hours. Back
- There were, however, important provincial exceptions. New Brunswick saw increases across all three consequence measures, Manitoba and Saskatchewan recorded higher rates of job change or labour market disruption by 2025, and Newfoundland and Labrador experienced a very large fall in the share reporting fewer hours worked, paired with a large rise in postponed return to work. Back
References
Akbari, E., McCuaig, K., Schurter, M., Varmuza, P., Akbari, S., & Mudie, S. (2024). Knowing Our Numbers: A Provincial Study with a Local Lens on the Early Childhood Education Workforce in Ontario.
Barros, R., Olinto, P., Lunde, T., & Carvalho, M. (2011). The impact of access to free child care on women’s labor market outcomes: Evidence from a randomized trial in low-income neighborhoods of Rio de Janeiro. World Bank Economic Review, 25(3), 493–520. https://doi.org/10.1093/wber/lhr004
Baker, M., Gruber, J., & Milligan, K. (2008). Universal child care, maternal labor supply, and family well-being. Journal of Political Economy, 116(4), 709–745. https://doi.org/10.1086/591908
Baker, M., Gruber, J., & Milligan, K. (2015). Non-cognitive deficits and young adult outcomes: The long-run impacts of a universal child care program. Journal of Public Economics, 131, 1–15. https://doi.org/10.1016/j.jpubeco.2015.09.001
Baker, M., Gruber, J., & Milligan, K. (2026). Investing in mothers? The long-run impact of a universal child care program on maternal work and income (Working Paper). https://sites.google.com/view/kevin-milligan/home/research/bgm-childcare3
Berlinski, S., & Galiani, S. (2007). The effect of a large expansion of pre-primary school facilities on preschool attendance and maternal employment. Labour Economics, 14(3), 665–680. https://doi.org/10.1016/j.labeco.2007.01.003
Brouillette, D., Fortin, P., Godbout, L., & St-Cerny, S. (2021). The economic return of Quebec’s child care system. Université du Québec à Montréal.
Canada Revenue Agency. (2025a). Federal income tax rates and brackets. Government of Canada.
Canada Revenue Agency. (2025b). Canada Pension Plan (CPP) contribution rates. Government of Canada.
Canada Revenue Agency. (2025c). GST/HST rates and rules. Government of Canada.
Canada Revenue Agency. (2025d). Canada Child Benefit (CCB) payment calculations. Government of Canada.
Cascio, E. U. (2009). Maternal labor supply and the introduction of kindergartens into American public schools. Journal of Human Resources, 44(1), 140–170. https://doi.org/10.3368/jhr.44.1.140
Cascio, E. U., & Schanzenbach, D. W. (2013). The impacts of expanding access to high-quality preschool education. Brookings Papers on Economic Activity, 47(2), 127–192.
Charters, T. J., & Findlay, L. C. (2024). Child care centre workers serving children aged 0 to 5 years in Canada, 2021 to 2022. Economic and Social Reports. Statistics Canada. doi: 10.25318/36280001202401200004-eng
Child Care Resource and Research Unit. (2025). Early childhood education and care in Canada 2024: Interim space statistics. Toronto, ON.
Cleveland, G. (2023). Why the preference for not-for-profit and public child care services? Submission to the House of Commons Standing Committee considering Bill C-35.
Cleveland, G., & Krashinsky, M. (1998). The benefits and costs of good child care: The economic rationale for public investment in young children. University of Toronto.
Cleveland, G., & Krashinsky, M. (2020). Affordable child care is good economic policy. Centre for Spatial Economics.
Cleveland, G., & Krashinsky, M. (2004). Financing early learning and child care in Canada. Canadian Council on Social Development.
Deming, D. (2009). Early childhood intervention and life-cycle skill development: Evidence from Head Start. American Economic Journal: Applied Economics, 1(3), 111–134.
Department of Finance Canada. (2021). Budget 2021: A Canada-wide Early Learning and Child Care Plan. Government of Canada.
Dustmann, C., Raute, A., & Schönberg, U. (2013). Does universal child care matter? Evidence from a large expansion in pre-school education (IZA Discussion Paper No. 8256).
Employment and Social Development Canada. (2025). Analysis of the impact of alternative child care policies on parents’ labour force participation and economic well-being. Government of Canada.
Employment and Social Development Canada. (2026). Progress and impact of Canada-wide Early Learning and Child Care. Government of Canada.
Felfe, C., Nollenberger, N., & Rodríguez-Planas, N. (2016). Can’t buy mommy’s love? Universal child care and children’s long-term outcomes. Journal of Population Economics, 29(2), 393–422. https://doi.org/10.1007/s00148-015-0586-x
Fortin, P., Godbout, L., & St-Cerny, S. (2012). Impact of Quebec’s universal low-fee child care program on female labour force participation, domestic income, and government budgets. Université du Québec à Montréal.
Friendly, M., Beach, J., Aruran, G., Cossette, A., Hu, L., Lillace, J., & Forer, B. (2026). Early childhood education and care in Canada 2024/2025. Childcare Resource and Research Unit.
Friendly, M., Beach, J., Aruran, G., Cossette, A., Hu, L., Lillace, J., & Forer, B. (2025). Interim space statistics 2024: Early childhood education and care in Canada. Childcare Resource and Research Unit.
Friendly, M. (2025). Deconstructing “fake non-profit” child care in Canada: What is it and what isn’t it? What should the response be under the $10-a-day plan? Childcare Resource and Research Unit.
Friendly, M., Feltham, L., Mohamed, S. S., Nguyen, N. T., Vickerson, R., & Forer, B. (2020). Early childhood education and care in Canada 2019. Childcare Resource and Research Unit.
Goelman, H., Forer, B., Kershaw, P., Doherty, G., Lero, D., & LaGrange, A. (2006). Towards a predictive model of quality in Canadian child care centers. Early Childhood Research Quarterly, 21(3), 280–295.
Government of Canada. (2024). Canada Early Learning and Child Care Act, S.C. 2024, c. 2.
Gu, W. (2022). The value of unpaid childcare and paid employment by gender: What are the impacts of the low-fee universal childcare program? Economic and Social Reports. Statistics Canada.
Haeck, C., Lefebvre, P., & Merrigan, P. (2015). Canadian evidence on ten years of universal preschool policies: The good and the bad. Labour Economics, 36, 137–157. https://doi.org/10.1016/j.labeco.2015.05.002
Havnes, T., & Mogstad, M. (2011). No child left behind: Subsidized child care and children’s long-run outcomes. American Economic Journal: Economic Policy, 3(2), 97–129. https://doi.org/10.1257/pol.3.2.97
Havnes, T., & Mogstad, M. (2015). Is universal child care leveling the playing field? Evidence from non-linear difference-in-differences. Journal of Public Economics, 127, 100–114. https://doi.org/10.1016/j.jpubeco.2014.07.006
Heckman, J. J., Moon, S. H., Pinto, R., Savelyev, P., & Yavitz, A. (2010). The rate of return to the HighScope Perry Preschool Program. Journal of Public Economics, 94(1–2), 114–128. https://doi.org/10.1016/j.jpubeco.2009.11.001
Jappelli, T., & Pistaferri, L. (2010). The consumption response to income changes. Annual Review of Economics, 2, 479–506.
Kottelenberg, M. J., & Lehrer, S. F. (2017). Targeted or universal coverage? Assessing heterogeneity in the effects of universal childcare. Journal of Labor Economics, 35(3), 609–653. https://doi.org/10.1086/691291
Lefebvre, P., & Merrigan, P. (2008). Child-care policy and the labor supply of mothers with young children: A natural experiment from Canada. Journal of Labor Economics, 26(3), 519–548. https://doi.org/10.1086/588883
Lefebvre, P., Merrigan, P., & Verstraete, M. (2009). Dynamic labour supply effects of child care subsidies: Evidence from a Canadian natural experiment. Labour Economics, 16(5), 490–502. https://doi.org/10.1016/j.labeco.2009.03.002
Lero, D. S., Prentice, S., Friendly, M., Richardson, B., & Fraser, L. (2021). Non-standard work and child care in Canada: A challenge for parents, policy makers, and child care provision. Childcare Resource and Research Unit and University of Guelph.
Macdonald, D. (2025). Cash cow: Assessing child care space creation progress. Canadian Centre for Policy Alternatives.
Macdonald, D., & Friendly, M. (2025). The price is not right (yet): $10-a-day child care falling short of target: Child care fees in Canada, 2025. Canadian Centre for Policy Alternatives.
Macdonald, D. (2026). The last mile: Provincial child care expansion at the five-year deadline. Canadian Centre for Policy Alternatives.
Mahboubi, P., & Zhang, T. (2026). Affordable but unavailable: National childcare’s supply crisis. C.D. Howe Institute.
Montpetit, S., Carrer, L., & Beauregard, P.-L. (2025). A welfare analysis of universal childcare: Lessons from a Canadian reform (Warwick Economics Research Papers Series No. 1584). University of Warwick, Department of Economics.
The Muttart Foundation. (2025). An assessment of the impact of affordability funding changes on lower-income families and their access to regulated child care. The Muttart Foundation.
Nollenberger, N., & Rodríguez-Planas, N. (2015). Full-time universal child care in a context of low maternal employment: Quasi-experimental evidence from Spain. Labour Economics, 36, 124–136. https://doi.org/10.1016/j.labeco.2015.02.008
OECD. (2025). Reducing inequalities by investing in early childhood education and care. Starting Strong. OECD Publishing. doi: 10.1787/b78f8b25-en
Office of the Auditor General of Alberta. (2025). Child Care Subsidy and Grants Program. Office of the Auditor General of Alberta.
Office of the Auditor General of British Columbia. (2025). Child Care Licensing Capacity. Office of the Auditor General of British Columbia.
Office of the Auditor General of Canada. (2025). Canada-Wide Early Learning and Child Care System. 2025 Reports of the Auditor General of Canada to the Parliament of Canada.
Office of the Auditor General of Ontario. (2025). Canada-wide Early Learning and Child Care Program: Special Report 2025—Performance Audit. Office of the Auditor General of Ontario.
Provincial Auditor of Saskatchewan. (2025). 2025 report, Volume 2: Education—Achieving accessible child care. Office of the Provincial Auditor of Saskatchewan.
Seward, B., Dhuey, E., & Pan, A. (2023). The Big Short: Expansion of early childhood education in post-pandemic Canada. Canadian Public Policy, 49(3), 306–329. doi: 10.3138/cpp.2022-059
Shariati, A. (2024). Workforce constraints in early childhood education in Canada. Centre for the Study of Living Standards.
Statistics Canada. (2018). Paid and unpaid work among mothers in Quebec and the rest of Canada. Government of Canada.
Acknowledgments
The CSLS gratefully acknowledges the YMCA’s support for this research. The author thanks Kevin Milligan, Emis Akbari and Gordon Cleveland for their comments, as well as researchers at the Atkinson Centre for Society and Child Development and George Brown College, participants in the CSLS seminar series held on March 12, 2026, and participants in the CSLS session at the Canadian Economics Association Annual Meeting on the Economic Impacts of Canadian Child Care held in Vancouver on May 29, 2026, for their constructive feedback. Special thanks to CSLS staff Shom Patel and Remi Royer for their excellent research assistance throughout this project. Any remaining errors are the author’s. The views and conclusions expressed in this report are those of the authors and do not necessarily reflect those of YMCA Canada.
Press Release
New CSLS Report Finds Canada’s $10-a-Day Child Care Program Increased Maternal Employment by 29,000 WorkersJune 22, 2026
OTTAWA — A new report from the Centre for the Study of Living Standards (CSLS) finds that Canada’s $10-a-day child care initiative has increased maternal employment and generated measurable economic returns. Using Labour Force Survey microdata, the report estimates that the Canada-Wide Early Learning and Child Care (CWELCC) system — which was launched in 2021 with historic investments — increased maternal employment by approximately 29,000 workers by the end of 2025, corresponding to a direct GDP gain of roughly $2.7 billion annually.
The report, “The Economic Returns of Accessible and Affordable Child Care in Canada,” finds that significant progress has been made on affordability, with average child care expenses falling sharply since the introduction of CWELCC.
Progress on access, however, has lagged behind. Despite creating more than 168,000 new child care spaces as of March 31, 2025, access remains constrained, with many families still reporting difficulty finding care, limiting the extent to which lower fees translate into actual use.
“Our analysis suggests that CWELCC reforms are linked to meaningful economic returns by enabling thousands of mothers to participate in the labour force,” said Alisaleh Shariati, Economist at CSLS and author of the report.
Shariati added that, “Looking ahead, the unrealized economic returns are now driven less by affordability than by the challenge of further expanding the child care system. More staffed spaces are needed for expansion, which requires a stronger early childhood workforce. This would allow more families to access child care and, in turn, participate more fully in the economy — delivering even more significant economic benefits for Canadians.”
Key Findings- Significant affordability gains: Between 2021 and 2022, fees across regulated settings fell by more than half nationally. On top of these major reductions, among children aged 0 to 5 using child care, average annual parental expenses fell by roughly $1,400 between 2022 and 2025, with a larger decline of $2,400 for centre-based care.
- Employment effects: Using Statistics Canada microdata, CSLS estimates suggest that CWELCC expansion has increased maternal employment by approximately 29,000 workers by the end of 2025.
- Broader economic returns: The increase in maternal employment corresponds to an estimated direct GDP gain of roughly $2.7 billion per year or $13.5 billion over 5 years.
- Access constraints: More than 168,000 new child care spaces were created as of March 31, 2025, but waitlists have grown and access remains a significant barrier for many families.
- Workforce bottlenecks: Persistent shortages of early childhood educators and assistants remain a key constraint on further system expansion.
- Large unrealized gains: Illustrative modelling scenarios suggest that resolving access barriers could unlock an additional $10.9 billion to $15.6 billion in GDP in 2025.
- International evidence: Evidence from Quebec and other jurisdictions shows that low-cost, universal child care can generate large economic returns through higher maternal employment, higher earnings over the lifecycle, and strong fiscal benefits.
This report, The Economic Returns of Accessible and Affordable Child Care in Canada, was prepared by the Centre for the Study of Living Standards (CSLS) with support from YMCA Canada. The report examines the early evidence on the economic impacts of Canada’s Canada-Wide Early Learning and Child Care (CWELCC) system. It assesses the effects of lower child care fees on maternal labour force participation and employment and estimates the resulting economic returns. It also identifies the remaining workforce and access constraints that prevent the system from realizing it full potential.
About the CSLSThe Centre for the Study of Living Standards (CSLS) is Canada’s leading think tank focused on productivity, living standards, and economic well-being. Founded in 1995, we provide rigorous, evidence-based research to inform policy and support a more prosperous and equitable society.
Media ContactAlisaleh Shariati, Economist
Centre for the Study of Living Standards
Tel: 226-234-6747
Email: Ali.Shariati@csls.ca