Abstract
Why did U.S. manufacturing productivity stop growing after 2010? Productivity growth actually disappeared, from an annual rate of +3.3 per cent during 1987-2010 to -0.3 per cent from 2010 to 2023. This article shifts attention from 2010 as the start of the productivity growth slowdown to a decade earlier when output stopped growing. This cessation of output growth in 2000 is attributed to the invasion of imports that closed domestic plants, destroyed jobs, and squeezed profits. After 2000, a chain of causation followed that ultimately undermined productivity growth — from falling capacity utilization, to lower investment in fixed capital and research and development, and an erosion of innovation. Beyond the import invasion, the disappearance of productivity growth is also attributed to a general phenomenon of diminishing returns to innovation, the feeble influence of robots, government regulations that distorted investment, and a shrinking supply of skilled labour in the face of increasing skill demands.
1. Introduction
While the manufacturing sector produces only 10 per cent of U.S. gross domestic product (GDP), it accounts for more than half of U.S. research and development (R&D) and produces most of U.S. exports, fixed investment, and consumer goods. Yet the former dynamism of that sector appears to have vanished. The growth rate of labour productivity in U.S. manufacturing in official data — produced by the Bureau of Labor Statistics (BLS) and Bureau of Economic Analysis (BEA) — was 3.3 per cent per year over the 23 years between 1987 and 2010. But then growth disappeared, registering a negative rate of -0.3 per cent over the following 13 years between 2010 and 2023.1 The vanishing of productivity growth in U.S. manufacturing raises deep questions about the historical core of American prosperity.
How could productivity growth in the entire manufacturing sector completely disappear? Has U.S. manufacturing lost its ability to compete? A substantial literature has emerged that examines numerous possible causes of the productivity slowdown. But those papers contrast productivity growth before and after 2010, with little or no attention to profound changes that occurred before 2010. Yet the deep malaise of U.S. manufacturing began at least a decade earlier. While productivity growth was zero after 2010, manufacturing gross output in the year 2000 began a 23-year interval of zero annual growth.2 That is, the level of manufacturing gross output (which includes the value of intermediate inputs) was the same in 2023 as in 2000, while the level of real GDP (which nets out the value of intermediate inputs) was 57 per cent higher, a stunning contrast.
By what channels does a flood of imported goods undermine the efficiency and viability of domestic manufacturing firms? We find that there is a strong negative correlation across the 19 three-digit manufacturing industries between the post-1987 rise in import penetration and the subsequent post-2000 stagnation of domestic output. Foreign competition not only causes plant closures in the most affected industries like furniture, textiles, and apparel, but squeezes profits throughout other parts of the manufacturing sector, thus cutting funding for fixed investment as well as R&D. There is a striking shift from positive to negative growth of investment after 2000 in many manufacturing industries. Further, when innovation originates from foreign producers of imports, domestic firms lose touch with leading-edge technology, are less able to achieve their own technological advances, and are less able to obtain critical inputs from domestic sources.
There are limits to the import/offshoring explanation of the productivity growth slowdown. By 2018, import penetration (defined as imports divided by imports plus domestic production) had reached 30 per cent or above in half of the manufacturing industries. Averaged across the 19 industries, import penetration increased from 13 per cent in 1988 to 28 per cent in 2018; in the latter year import penetration ranged all the way from 5 per cent in petroleum to 97 per cent in apparel. Yet the productivity growth slowdown was larger for petroleum than for apparel, suggesting that offshoring and imports provide only a partial explanation of productivity growth patterns.
We broaden the investigation by examining symptoms of a deeper malaise that extends beyond manufacturing into the rest of the American economy. A recent New York Times editorial reports decades during which the American shipbuilding industry has delivered ships billions of dollars over budget, years behind schedule, that fail to perform as specified. The U.S. aircraft industry takes 12 years to deliver a new military fighter or bomber. “America’s defense industry, like much of the economy, has lost the ability to build quickly and effectively” (New York Times Editorial Board, 2025).
This article begins with measurement issues. A recent paper by Atalay et al. (2025) convincingly argues that the Producer Price Index (PPI) used by the BEA to deflate output in a given category of goods systematically rises faster than the corresponding Consumer Price Index (CPI), due at least in part to more extensive correction for quality change in the CPI. We incorporate their price adjustments for all of the 19 industries except the computer and electronics industry, where we rely instead on the original research of David Byrne and his coauthors. Because the Atalay-Byrne price adjustments are of roughly the same magnitude before and after 2010, they do not explain any of the productivity growth slowdown, in fact the reverse.
We differ from the previous literature along two other dimensions. Unlike previous papers, including Atalay et al. (2025), that examine the slowdown of total factor productivity (TFP) growth, we focus instead on labour productivity growth, defined as growth in gross output per hour instead of real value-added per hour. Several previous papers have shown that the difference between these two, i.e., intermediate inputs, is subject to “offshoring bias” that can cause the growth of inputs to be understated, and hence the derived growth of value added and TFP to be overstated (Houseman et al. 2011). A second difference with other research is that we choose 2005 rather than 2010 as the break year to define the slowdown for reasons related to the timing effects of the 2008-09 recession.
The article begins with measurement issues and continues with an examination of differences in the magnitude of the slowdown across the 19 manufacturing industries. We then study the channels by which growing import penetration contributed to the cessation of output growth after 2000 and productivity growth after 2010. Next, we examine the sources of declining innovation as a side-effect of shrinking public R&D, changing corporate strategies about private R&D, and the evidence of diminishing returns to R&D in creating innovation. Finally, we examine three additional causes of the slowdown, including the robot puzzle; the role of government regulations in distorting investment and reducing productivity; and the persistent shortage of skilled labour in manufacturing.
2. Measurement: Inflation Bias, Break Date, and Offshoring Bias
2.1 Price Deflator Bias
For many decades economists have demonstrated that price indexes — particularly for durable goods — overstate inflation by failing to take account of quality change and the value of new products. A comprehensive set of new measures of durable goods prices was provided by Gordon (1990). Gradually over the years the BLS has incorporated into its price indexes better measures of quality change, but evidence is not usually available to extend the quality adjustments backwards in time. This leads to a presumption that the extent of upward inflation bias in deflators, and the resulting downward bias in the growth of real output, diminishes over time. Ironically this measurement issue would tend to make pre-2010 productivity growth rates too low, since less accurate price measurement would make pre-2010 output growth rates understated more than their post-2010 counterparts.
A recent attempt partially to address the inflation bias issue has been provided in a much-noticed paper by Atalay et al. (2025). They argue that the BLS devotes more resources to making quality adjustments in the CPI than the PPI and Import Price Index that are currently used to deflate gross output and intermediate inputs. To reduce this quality change bias, the authors carry out the complex task of using input-output tables to match CPI products with specific industries. We accept the Atalay corrections for all of the 19 industries except for the computers and electronic products industry.3 For that we adopt price change corrections suggested by David Byrne based on research by himself and coauthors.4 The Byrne corrections for computers and electronics alter the growth rate of the BEA deflators by -6.9 per cent per year for 1987-2010 and by -5.4 per cent for 2010-23.
For total manufacturing, the CPI substitution raises output growth by 1.6 per cent per year for 1987-2010 and by 1.0 per cent for 2010-23. The adjustments for durable goods are 2.7 and 2.2 per cent respectively, much of which is due to the computer industry. When this industry is excluded the durable goods adjustments drop to 1.8 for both intervals. The nondurable goods adjustments are 1.0 and 0.5 per cent. Except for durables excluding computers, all of these adjustments are smaller for post-2010 than pre-2010, implying that the Atalay revisions do not help explain the productivity growth slowdown at all, but rather make it slightly larger. What they do accomplish is to eliminate, if only slightly, the puzzle of “disappearing” productivity growth in manufacturing, as the 2010-23 productivity growth rate is boosted from -0.3 to +0.7 per cent per year. All productivity growth numbers cited in this article henceforth use only the Atalay-Byrne adjusted data.5
2.2 Implications of Offshoring Bias
As emphasized in the 1996 Boskin Commission report, a source of upward bias in the CPI has long been “outlet substitution bias.” When the price quote for a given product sold at a full-price merchant like Macy’s is replaced by the lower price sold at a rising discount merchant like Walmart, the CPI methodology links out the price decrease and so the benefit to the consumer is not captured in the index. Houseman et al. (2011) identified a parallel price index bias that occurs for the same reason but, rather than involving domestic full-price and discount merchants, instead contrasts intermediate materials previously sold by high-cost domestic producers which are replaced by lower-cost imported materials. The price quotes for the former high-cost domestic producer are not directly linked to the new lower price quote from the foreign supplier. Thus the actual price decline is missed in the deflator for intermediate materials.
This “offshoring bias” leads to an upward bias in the price change of intermediate goods and corresponding downward bias in the growth of real intermediate materials inputs. This matters because real gross output change is based on original data (subject to the price measurement issues discussed above). But everything else in growth accounting is a derived number. If offshoring bias is significant, then the growth of real value added (RVA, that is, gross output growth minus intermediate materials growth) is overstated. Because TFP growth is calculated as RVA growth minus the contributions of capital deepening and labour composition, TFP growth is overstated as well. To the extent that capital input production shifts from domestic to foreign sources, the upward bias in TFP measures is compounded.
Most of the recent literature on the productivity slowdown, including the Atalay paper, focuses on comparisons of TFP growth before and after 2010, and thus is subject to this source of overstatement of TFP growth. Whether this makes the TFP slowdown greater or smaller depends on whether offshoring bias was more or less important after 2010. One approach to assess its impact is to compare the growth of RVA which is altered by offshoring bias and gross output which is not. In our Atalay/Byrne-adjusted data RVA grows faster than gross output by 1.2 per cent per year in 1987-2010 and 0.8 per cent faster during 2010-23, so offshoring bias explains 0.4 annual percentage points of the slowdown in TFP growth leaving aside anything extra from capital deepening. To avoid the inaccuracy introduced by offshoring bias, our article examines only changes in labour productivity defined as gross output per hour and makes no further mention of RVA or TFP growth.
2.3 Break Year
We choose a different break year for defining the slowdown. Most of the recent literature uses 2010 as the break year, comparing 1987-2010 or 1997-2010 with 2010-23. This is understandable, since the puzzle of near-zero productivity growth begins when average growth rates are calculated starting with the 2010-11 annual change. That choice skews the outcome of the slowdown investigation, because the literature generally ignores the fact that the annual rate of change of labour productivity for the single year change of 2009-10 was 8.0 per cent for total manufacturing and 11.6 per cent for durable goods.
Gordon-Sayed (2025) have examined this jump in productivity in quarterly data where the large positive growth occurs in the last three quarters of 2009. Their explanation is that the rapid collapse of output in the fall of 2008, particularly in durable goods manufacturing, led firms to overreact and reduce work hours with a lag by a greater percentage than the decline in output, differing from previous recessions when the percentage change in hours was always less than in output. In their study of the business sector, they show that the “extra layoffs” of 2008-09 and corresponding temporary jump in productivity growth were followed by a rehiring reversal starting in 2010. They conclude that this artifact of the 2008-09 recession leads productivity growth to be overstated in 2008-09 in quarterly data and correspondingly understated in 2010-19 compared to the underlying determinants of trend productivity growth.
To avoid this cyclical distortion, we define the slowdown with 2005 as the break year instead of 2010. Given our desire to avoid any effect of the 2008-09 recession, we could have chosen 2007 instead of 2005. However, 2005 has the appeal that it makes our pre/post slowdown intervals an equal 18 years in duration (1987-2005 compared with 2005-23). The selection of 2005 as the cutoff year is reinforced by the previous research that identifies a structural break in U.S. TFP growth around 2004–2005 (2004Q4), marking the end of the late‑1990s/early‑2000s ICT-driven surge (Fernald, 2015).
The effects of our price adjustment and break year choices are summarized in Table 1. The top frame uses the break year 2010 for the official BEA/BLS growth rates. Two lines are shown for total manufacturing with and without the computer and electronic products industry. All productivity growth rates are defined as the average annual growth rate of gross output for a given interval minus the corresponding growth rate of labour hours.
In the top frame the two growth slowdowns are 3.6 and 2.9 per cent per year, respectively. We will find throughout the article that when the computer industry is excluded the magnitude of the productivity growth slowdown is substantially reduced. The 2010-23 productivity growth rates are negative for both lines in the top frame.
The next frame of Table 1 shows the same growth rates after the Atalay/Byrne price deflator adjustments are applied. The pre/post 2010 growth rates are boosted by about the same amount and so the magnitude of the slowdown is changed only slightly by +0.5 and +0.2 percentage points respectively. That is, the alternative price deflators raise the magnitude of the slowdown for both rows. The post-2010 growth rates of productivity are boosted enough to become positive rates. Thus, the price adjustments “solve” the puzzle of why productivity growth in manufacturing completely disappeared after 2010 but do not shed any light on the magnitude of the slowdown.
The bottom frame of Table 1 calculates the same growth rates when the break year is switched from 2010 to 2005. The growth rates for 1987-2005 are slightly higher than for 1987-2010, simply because the growth rates in the 2005-10 subinterval are lower than the pre-2005 growth rates. But the 2005-10 growth rates are substantially higher than for 2010-23, raising the resulting 2005-23 growth rates by between 0.9 and 0.7 per cent annually compared to 2010-23 for total manufacturing with and without the computer/electronic industry, respectively.
The switch of break dates accomplishes a small part of our goal to explain as much as possible of the productivity growth slowdown. The choice of the 2005 break date reduces the slowdown by 0.6 percentage points for both rows. Overall, the price-adjusted slowdown for total manufacturing of 4.1 percentage points is reduced to 3.5 points by switching the break year, and to 2.5 points by excluding the computer industry. These two changes achieve a 39 per cent reduction in the overall magnitude of the slowdown ((4.1-2.5)/4.1).
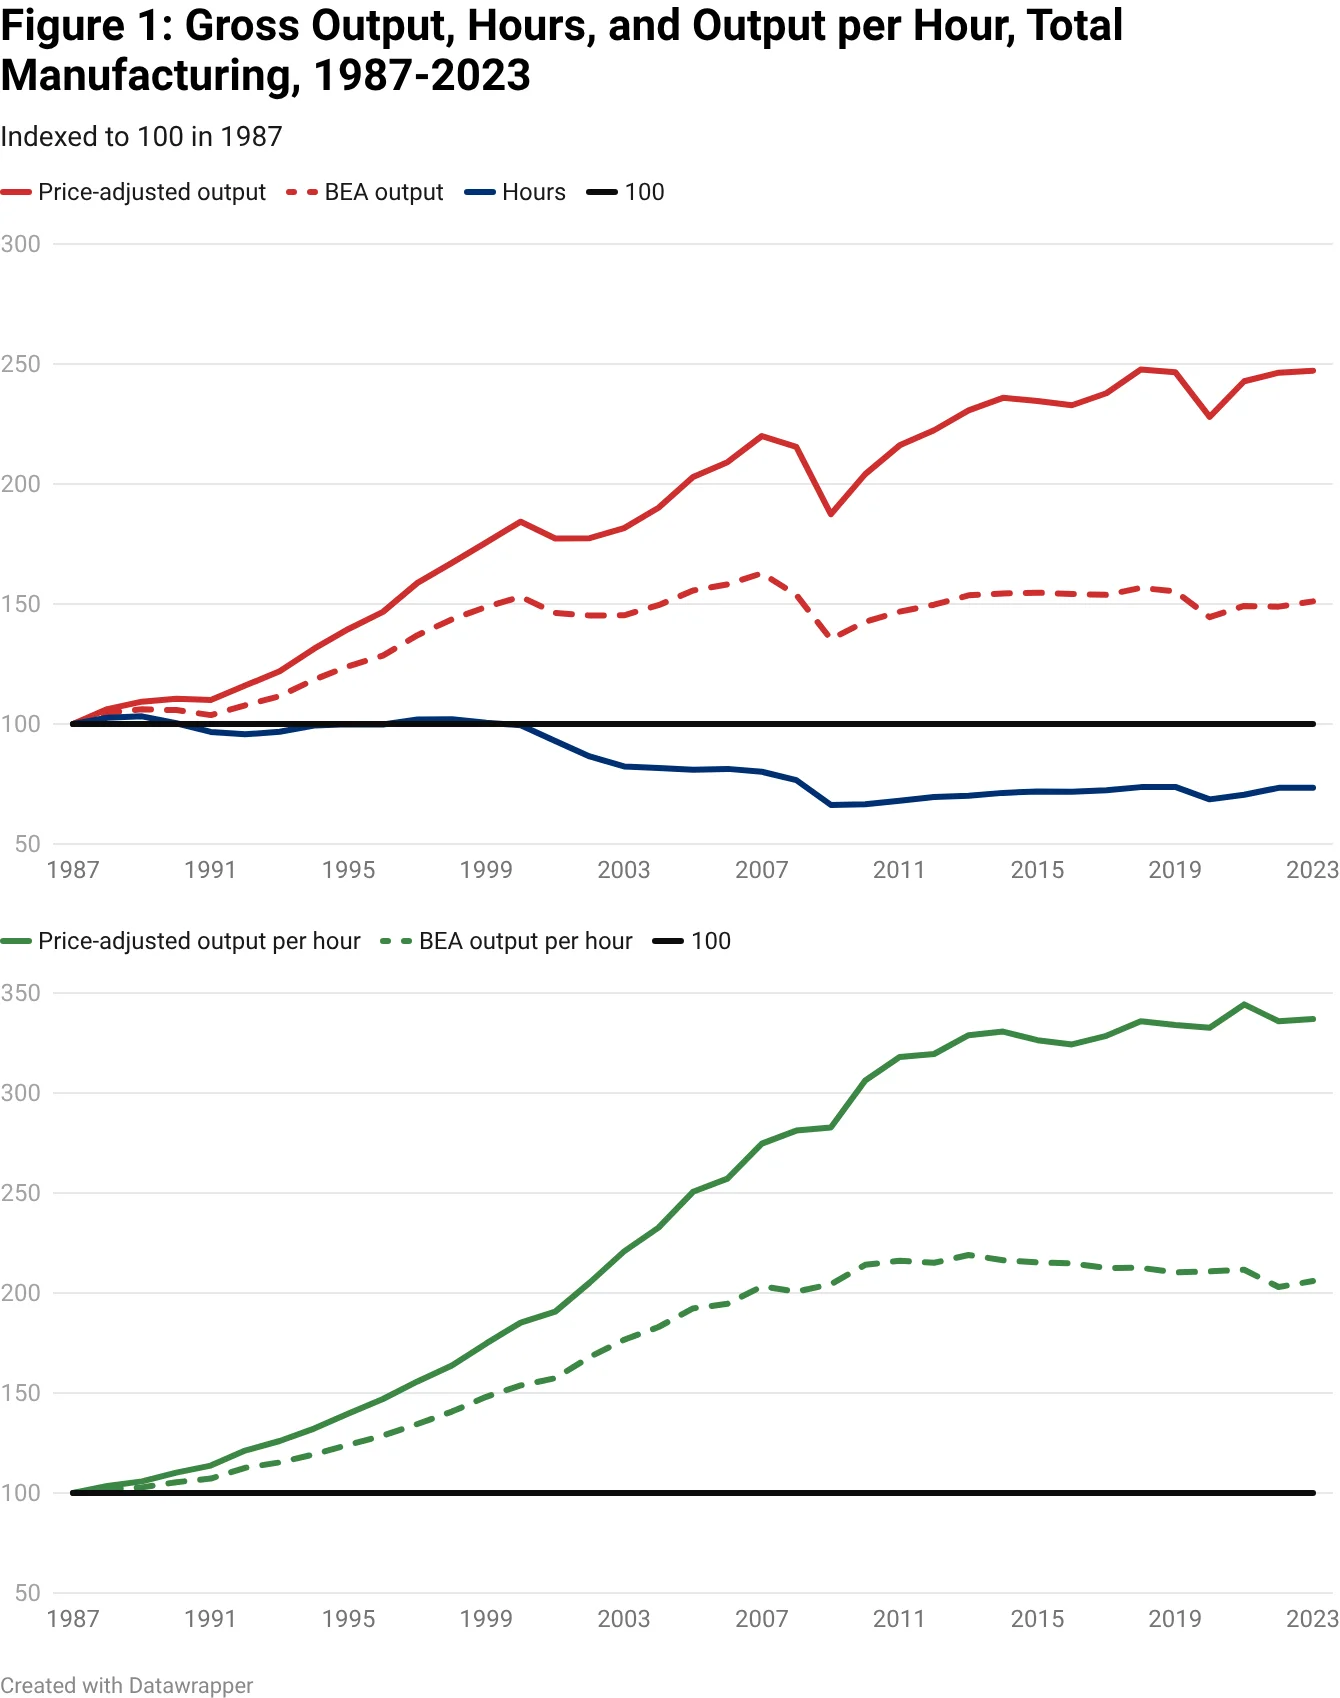
How is the evolution of labour productivity divided between its output numerator and hours denominator? The top frame of Figure 1 displays index numbers (1987=100) for output in red and hours in blue, with the corresponding index number for labour productivity as the green lines in the bottom frame. Dashed lines represent the official BEA/BLS series for output and productivity, while the solid lines plot the series after applying the Atalay/Byrne price adjustments. By depicting the year-by-year evolution of the data, Figure 1 provides additional insight into the timing of the phenomena that we need to explain.
The previous literature has focused on the post-2010 productivity growth slowdown but has generally not noticed another stark slowdown ten years earlier, that of output growth after 2000. The official BEA output series, shown by the dashed red line, stagnates after 2000, with a 2000-23 annual growth rate of -0.1 per cent, sharply down from the 3.3 per cent annual growth rate that occurred during 1987-2000. The price adjustments raise the 2000-23 growth rate of output slightly to a positive 1.3 per cent per year, but the sharp downturn from 1987-2000 to 2000-23 is roughly the same, from 4.7 to 1.3 per cent. We shall return to the theme below that the seeds for the near-disappearance of productivity change after 2010 were planted a decade earlier in 2000 when the import invasion began to swamp domestic industries.
Figure 1 also shows that the 2000-10 decade was different from either pre-2000 or post-2010. The price-adjusted output series shown by the solid red line grew at only 1.0 per cent per year, while employment collapsed, registering an annual growth rate of -4.0 per cent per year. Thus, the apparent similarity of productivity growth in 1987-2000 and 2000-2010, 4.7 and 5.0 per cent respectively, disguises a stark change from healthy output growth and stable employment before 2000 to stagnant output and rapidly collapsing employment during 2000-10. To the extent that the surge of imports caused the post-2000 transition, plant closings of low-productivity plants changed the mix within those industries to higher productivity plants and firms. This is part of the reason that productivity growth remained positive after 2000 through 2010. We return to this theme below.
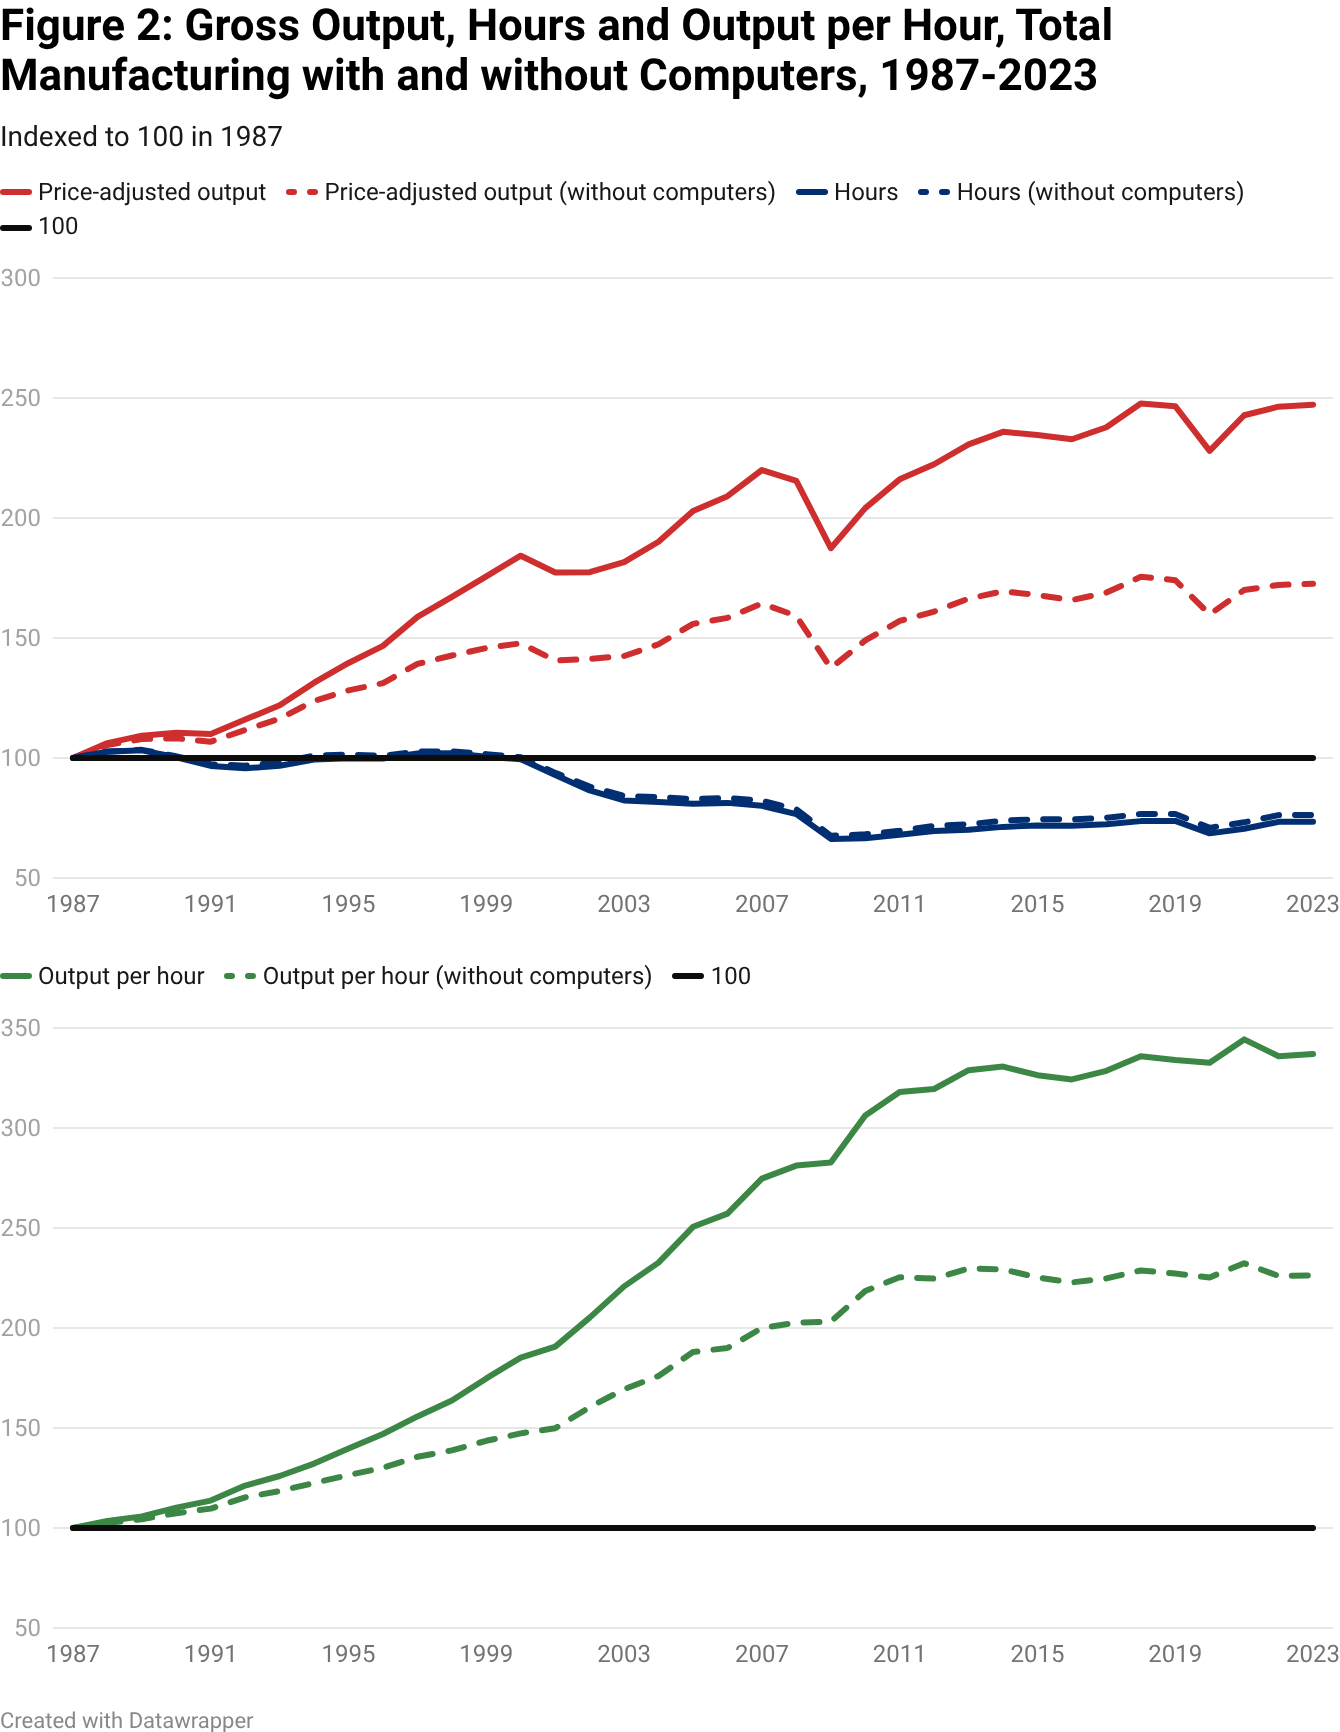
In Figure 2 the solid lines are the same as in Figure 1, while the dashed red and green lines plot the price-adjusted index numbers for output and productivity when the computer industry is excluded. The most important element of Figure 2 is the dashed red line showing that when computers are excluded, output stagnated after 2000, achieving an annual growth rate between 2000 and 2023 of only 0.7 per cent per year after growing at 3.0 per cent per year during the 13 years prior to 2000. For the 2000-10 decade this measure of output growth was 0.1 per cent per year. Thus for 18 of the 19 manufacturing industries the phenomenon of complete stagnation of output growth after 2000 remains valid even with the price adjustments and becomes one of the most interesting facts that needs to be explained. To what extent does the import invasion explain this output stagnation, and does the disappearance of output growth help explain, in turn, why productivity growth transitioned after 2010, when prices are adjusted and computers are excluded?
The lower frame in Figure 2 contrasts the index of manufacturing productivity with and without computers. With the 2010 break date excluding the computer industry explains 24 per cent of the productivity growth slowdown, while using the alternative 2005 break date, the computer contribution is an almost identical 29 per cent.6 Using conventional BEA/BLS data and a 1997-2023 time span with a 2011 break year, a recent report by Chittoor et al. (2025), found a computer industry contribution of 16 per cent.
3. Dimensions of Difference
If the productivity growth slowdown were accounted for by just a few industries and not by the rest of the 19 three-digit industries, then we could focus on a limited set of causes unique to those industries and not to others. But that approach does not work for the U.S. manufacturing productivity growth slowdown, because every one of the 19 industries experienced a post-2005 slowdown in labour productivity growth.
The price-adjusted productivity growth rates for 1987-2005 (dark blue bars) are contrasted with 2005-23 (light blue bars) in the twin charts of Figures 3 and 4. The magnitude of the slowdown is visible as the difference between the length of the dark and light blue bars. Durable goods industries are shown in Figure 3, and the computer industry is excluded to avoid distorting the scale. The ten durable goods industries in Figure 3 are ranked in descending order of the post-2005 slowdown.
An interesting feature of the ranking in Figure 3 is that the industries at the bottom with the smallest slowdowns achieved this standing not just because their productivity growth was higher after 2005 but because it was lower before 2005. On average the bottom four industries slowed from a pre-2005 growth rate of 4.4 per cent to a post-2005 growth rate of 3.2 per cent, or a slowdown of 1.2 per cent. In contrast the four industries at the top of Figure 3 had a higher average pre-2005 growth rate of 4.9 per cent and lower post-2005 growth of 1.5 per cent, resulting in a slowdown of 3.4 per cent per year. A noticeable difference is that most of the industries at the top of Figure 3 with the largest slowdowns produce relatively complex products, including electrical equipment, machinery, and autos, while most of the industries with smaller slowdowns at the bottom of the figure produce relatively simple products, such as primary metals, nonmetallic mineral products, and wood products.
Figure 4 shows the same display for nondurable goods. Here the pattern is different, with all nondurable industries having productivity growth rates close to zero for 2005-23, so that the chart’s ordering by slowdown rank is the same as the rank of 1987-2005 growth rates. The only exception is the food industry, which had very slow pre-2005 productivity growth and negative growth post-2005. For the nondurables in Figure 4 it is hard to discern any relationship between the slowdown by industry and the complexity of that industry’s products. The largest slowdown was in the petroleum and coal products industry, which experienced a remarkable 6.0 per cent slowdown (between 6.0 per cent growth pre-2005 to -0.1 growth post-2005).
While production in petroleum refineries is relatively complex with a large capital investment required, the next two ranked industries – textiles and apparel – are not capital intensive nor complex. These two industries are the poster children of the import invasion, particularly apparel where the import penetration ratio had reached 97 per cent by 2018. Apparel productivity growth during 1987-2005 appears to be at a relatively healthy 5.1 per cent, but that rate was achieved only because hours disappeared at a much faster annual rate (-6.9 per cent) than output (-1.8 per cent). Apparel productivity growth declined to 0.9 per cent after 2005.
The computer and electronic products industry was omitted from Figure 3 due to its extended horizontal scale and is shown separately in Figure 5. The top four bars trace its steady decline in productivity growth from 19.4 per cent during 1987-2000 to 7.2 per cent in 2010-23. Next on the chart are the dark and light blue bars recording the decline in productivity growth from 18.7 during 1987-2005 to 9.4 per cent in 2005-23. The bottom pair of two bars show the difference made when the Byrne price adjustment is excluded and we return to the original BEA/BLS growth rates that are 6.5 and 6.3 per cent slower, respectively.
The stark 9.3 per cent post-2005 decline in productivity growth for the computer industry has rightly attracted more attention than in any other manufacturing industry. We return below to Moore’s Law and its evolution over time along with other factors related to import competition that help as explanations. Here we note that, second only to the 97 per cent of the apparel industry, by 2018 the import penetration ratio for the computer and electronics industry had reached 84 per cent. The decline of this industry is inseparable from its mass offshoring migration to Asia.
4. The Import Invasion and Its Implications
Our primary focus is on the effects of import competition starting in the late 1990s as an important explanation of the productivity growth slowdown that is usually interpreted as starting a decade later. Figure 6 illustrates the expansion of imports from China, Mexico, Canada, and the rest of the world not as a percentage of all imports, but rather as a percentage of domestic U.S. manufacturing output. The import measure encompasses both intermediate goods and final goods that physically arrive in the United States. These ratios are shown for 1991, 2000, 2010, and 2023. Using the abbreviations IM for nominal imports and GO for nominal gross output, the import ratios in Figure 6 are IR = 100*IM/GO.
Figure 6 shows that for all countries the IR increased between 2000 and 2023 from 28 to 45 per cent.7 The decade 2000-2010, when so many domestic manufacturing jobs were destroyed, deserves the term “China Shock,” in the sense that the IR for China more than tripled during that decade, growing by 5.4 per cent of U.S. manufacturing output. China alone accounted for slightly more than half of the 10.1 percentage point increase in the IR for all countries during that decade. By comparison the Mexico IR in the same decade increased by only 1.4 percentage points. By 2023, however, the Mexico IR ratio increased by another 2.4 points from 2010 while the China ratio actually decreased by 1.4 points, and Mexico achieved the distinction of becoming the top importer to the United States.
4.1 Import Invasion and Output Stagnation
We can validate the role of rising imports as a major explanation for the disappearance of output growth after the year 2000. As shown in Figure 2 above, for the 18 industries excluding computers and including the price adjustments, the annual growth rate of output declined from 3.0 per cent per year in 1987-2000 to 0.1 per cent in 2000-10. Was the transition to post-2000 output stagnation related to the import invasion? The 2000-10 growth rates of output in the 18 industries are significantly negatively correlated with the rise of the import penetration ratio in each industry. The correlation coefficient is -0.69 of the individual industry 2000-2010 output growth rates with the 1989-2005 change in the IP ratio, and this is significant at the 1 per cent level.
The import surge not only reduced output growth in the 2000-10 decade and decimated hours and employment, but it had other effects as well on investment, R&D, and the pace of innovation. The displacement of domestic demand was the most obvious of these channels. Standardized goods impacted by low-cost foreign competition were purchased by consumers looking for the lowest prices, and in industries like textiles, apparel, toys, consumer appliances, and furniture, the demand for domestic production melted away. Between 2000 and 2010 output fell by 71 per cent in the domestic apparel industry, by 50 per cent in textiles, 38 per cent in furniture, and 33 per cent in electrical equipment and appliances.8
Not just in these most-exposed industries but in many others, import competition exerted intense pressure on prices and profit markups. Feenstra and Weinstein (2017) document the downward pressure on markups after 2000. Declining markups and profits directly reduce the resources available for capital investment and R&D, thus creating an indirect channel of causation from expanding imports to a decline in capital deepening and innovation.
Many firms responded to this profit pressure by offshoring the supply chain to reduce costs, in addition to their cost-reducing reductions of employment. This in turn resulted in the offshoring bias, as discussed above. As we have seen this leads to the overstatement of growth in RVA and TFP. Since most of the offshoring bias occurred during the 2000-10 decade, it raised the growth rate of TFP during that decade more than after 2010. This implies that studies of the TFP growth slowdown that use a 2010 break date (like Atalay et al., 2025) overstate TFP growth pre-2010 relative to post-2010 and thus exaggerate the magnitude of the TFP slowdown. This occurs in addition to the overstatement of the post-2010 slowdown caused by the 2009-10 cyclical distortion discussed above.
4.2 Reallocation and the 2000-10 Productivity Surge
We previously noted in the context of Figures 1 and 2 above that growth in both output and hours slowed by the same amount between 1987-2000 and 2000-10, implying that productivity growth exhibits no slowdown between those two intervals. But after 2000 the manufacturing economy suddenly shifted gears from healthy output growth with stable hours, to a very different regime of stagnant output with evaporating hours. Autor et al. (2013) explain why the employment decline was so persistent. Many of the plants most affected by the import invasion were located in relatively small cities and towns with few alternative employment opportunities. Displaced workers often could not afford to move, in part because the closing of the local factory decimated the local housing market and evaporated home equity, preventing moves to higher-cost locations.
The post-2000 transition changed the main source of productivity growth from innovation and capital deepening to reallocation when low-productivity plants closed and the mix within firms and industries shifted to higher productivity plants and firms. This mechanism is validated both theoretically and empirically by Bernard et al. (2006). The gain in productivity observed in our industry data does not represent healthy innovation but rather the closing of low productivity plants and the shift in production to higher efficiency plants. These authors document the impact of trade on the closing of inefficient plants. While productivity growth, whether through rising output or falling labour input, is not a concern in and of itself, efficiencies gained from mass closures of domestic plants pose welfare concerns for affected regions. Not only did single plants close but so did entire firms in the textile, apparel, and furniture industries, as well as such iconic firms as RCA and Zenith in consumer electronics. Melitz (2003) provides additional evidence on the intra-industry reallocation effect.
Bloom, Draca, and Van Reenen (2016) found the same effect in Europe, where a similar wave of Chinese imports caused inefficient plants to close and the more efficient plants to restructure, often by shedding labour. Kim (2019) reported a similar finding with the firm-level data in the Canadian manufacturing sector that showed rising import penetration from China shifting economic activities towards high productivity firms which offset the declines of TFP within firms. Thus, both in Europe and North America productivity growth during 2000-10, which appears to provide evidence of continuing healthy innovation as before 2000, actually may have been partly or largely due to plant closings and compositional effects. Since our data are totals for each of the 19 industries without intra-industry firm detail, we cannot measure the within-industry reallocation effects. There is little cross-industry correlation between the post-2000 change in output or productivity growth and the level of 2000 output per hour, indicating that the reallocation effect occurred within industries rather than between industries.
4.3 Investment, R&D, and Innovation
Competition from imports squeezed profits not only in the most exposed industries but throughout manufacturing. The negative impact on domestic investment was augmented by uncertainty and the increasingly attractive option of offshoring production and supply chains. Autor et al. (2020) document that firms most exposed to imports were most likely to reduce capital expenditures. By choosing not to invest in the newest and most efficient automation and manufacturing technologies, these firms lost the chance to implement innovations that were occurring in their particular industries.
As discussed above in our summary of Figure 1, the average annual growth rate of manufacturing output (including computers and price adjustments) slowed from 4.1 per cent in 1987-2005 to 1.3 per cent in 2005-23. Over the same period the average growth rate of real investment declined by about the same amount, from 5.0 to 1.0 per cent per year. Pierce and Schott (2017) highlight the role of the post-2000 Chinese import explosion in reducing investment in the subset of industries most exposed to import competition. Offshoring of the production process also played an important role in declining investment. A large literature on trade (Bernard, Jensen, and Schott, 2006; Acemoglu et al., 2016) documents that increasing imports led to a decrease in capacity utilization and lowered the necessity of additional capital investment within the U.S.
Another cause of lower investment growth in the early 2000s can be traced to the increasing financialization of the U.S. firms. Lazonick (2014) argues that corporations shifted towards a “downsize-and-distribute” regime that redirected earnings to financial interests instead of investment in production capacities, a trend that took off especially after the 2003 Securities and Exchange Commission rule change that made stock repurchases easier. Gutiérrez and Philippon (2017) show that 80 per cent of the decline in investment after 2000 can be accounted for by the amount firms spend on share buybacks.
The process by which low-cost import competition reduced investment had a similar effect on domestic R&D. Industries such as consumer electronics and primary metals shifted R&D activities abroad or concentrated them in large multinational firms that located R&D facilities in foreign countries rather than in the United States. There was also a process by which innovation shifted out of manufacturing to firms in the information technology industry like Apple, which developed software in Silicon Valley and other domestic locations while outsourcing the implementation of manufacturing process innovation to the Asian locations where the hardware device production was concentrated.
Using pre-2007 data from manufacturing patenting, Autor et al. (2020), show a decline in U.S. inventors’ patenting between 2000 and 2007 (which is the end of their sample period) can be linked to import competition. They find that this exposure leads to a decline in private firms’ R&D expenditure and a decline in patent applications. However, it is not clear that offshoring necessarily leads to fewer innovations. The authors also find that the negative impact of imports on innovation performance is larger in less profitable and less capital-intensive firms.
More broadly there are three possible reasons why offshoring may lead to a decline in manufacturing productivity growth. First, offshoring renders researchers and engineers unfamiliar with the manufacturing process, hindering further innovation. As the vice president of General Electric bluntly puts it in an interview with MIT Technology Review (2012), “you can design anything you want but if no one can manufacture it, who cares?” Consequently, offshoring is not simply moving low-skilled jobs abroad, but also makes “businesses dependent on someone else’s innovation for next generation products.” Leveraging an unexpected bilateral trade deal between U.S. and China in 1999, Bena and Simintzi (2025) find that offshoring reduces the willingness of firms to develop labour-saving technology for existing products.
Second, import competition also leads to a reallocation of researchers from manufacturing to service industries. Xu and Gong (2017) identify 47 science and engineering occupations. They find that for research occupations more exposed to import competition, researchers tend to shift from manufacturing to service industries (finance, personal services, business and repair services). For example, one standard deviation increase in occupation-level import competition leads to an 11.5 per cent increase in the share of researchers working in business and repair services.
Third, even if import competition reallocates research effort to firms with more market power, it does not always follow that more dominant firms become more efficient, and smaller, less efficient firms exit the market. There has been a decline in business dynamism in the US, and the dominant firms may have become less efficient over time (Gutierrez and Philippon, 2020; Covarrubias et al., 2019). Decker et al. (2016), show that within the manufacturing sector, the contribution of labour reallocation to TFP growth has declined.
4.4 Outsourcing of the Computer Industry to Asia
As we have seen, the import penetration ratio of the computer industry (NAICS 334) in 2018 had reached 84 per cent, almost as high as low-tech apparel at 97 per cent. The departure of the U.S. industry with the most rapid rate of productivity growth is a central element in the process by which the import tsunami reduced productivity growth in U.S. manufacturing. While the offshoring of apparel, furniture, toys, and other basic consumer products was primarily due to lower labour costs abroad, the surrender of the computer industry is a more complex tale, combining technological shifts, under-investment, U.S. managerial priorities and shortsightedness, and scale effects as ever-increasing Asian production further reduced costs through economies of scale while the reverse process took place in the residual production that remained in the United States.
The primary driver of computer offshoring, unlike the case of apparel and toys, was not low labour costs. Dedrick, Kraemer, and Linden (2010) have shown that labour represents only about five per cent of the cost of manufacturing computer hardware. The offshoring of computer production bears some similarity to the auto industry, where in the 1980s Japanese firms pioneered the “just-in-time” production system that produced automobiles that were not just less expensive but were of higher quality and were more reliable.9 Asian makers of computer components excelled in “process engineering.” Firms in Japan, South Korea, and Taiwan learned to excel at continuous improvement, rapid defect detection, and tight tolerances. Additional sources of electronics offshoring to Asia include government subsidies, the geographical clustering of the supply chain, and greater support for worker training.
5. Innovation and Diminishing Returns
5.1 Declining Innovation
The diminished contribution of innovation to productivity growth can be divided into three separate causes, all involving R&D. The first is the decline of public research, the second the retreat of corporate research from basic science, and the third and perhaps most important, decreasing returns to R&D investment. This set of factors is particularly important for understanding the manufacturing slowdown, since that sector of the economy accounts for two-thirds of R&D expenditure and the related problems are more acute in manufacturing than in the rest of the economy.
Public R&D expenditure declined steadily from its peak of 2.0 per cent of GDP in 1964 to only around 0.7 per cent of GDP in recent years. Gruber and Johnson (2019) argue that revitalizing public research is crucial for future productivity growth, based on the traditional role of positive externalities. In contrast private firms often shun long term projects that are potentially beneficial to society. For instance, Pfizer terminated its R&D efforts on Alzheimer’s and Parkinson’s diseases in early 2018, not because of a lack of funds, but because the patent protection period was too short for the firm to make a profit. In contrast, public research has a long-term horizon. Azoulay et al. (2019) and others point to the army-sponsored Advanced Research Projects Agency (ARPA) which has played a substantial role in the early stages of high-profile inventions, including the internet, personal computers, lasers, and Microsoft Windows.
The decline in public research was aggravated by the retreat of corporate research. Arora et al. (2019), emphasize that U.S. research prior to the 1980s was characterized by giant corporate labs, such as the Bell Lab of AT&T, and research units of DuPont and Xerox, all of which were manufacturing firms. These corporate research clusters focused on general purpose technologies and worked across disciplines on a large scale. However, large companies shifted from general basic science to narrow commercial development starting in the 1980s. As Arora et al. (2015) show, companies became less willing to invest in basic science in part because the results could benefit business rivals.
In recent years attention has shifted to the third factor, diminishing returns to research investment. This in part reflects the influence of a much-cited paper by Bloom et al. (2020), claiming that “new ideas are getting harder to find.” Their two main examples are the development of new drugs by pharmaceutical companies and, for computers, Moore’s Law showing that the number of transistors on a semiconductor chip doubles every two years. The steady exponential growth embodied in Moore’s law has required an increase in the number of research workers by a factor of 18 over the previous four decades.
5.2 Fading Pharmaceuticals
Our 19-industry database covers three-digit industries including chemicals (NAICS 325) but not four-digit industries including pharmaceuticals (industry 3254). BLS (2018) shows that this four-digit industry makes the fourth-largest contribution to the manufacturing TFP slowdown from 1992-2004 to 2004-2016. Growing R&D costs and a higher termination rate of projects are two prominent corollaries of the slowdown. Anticipating in part the Bloom et al. (2020), research, Deloitte (2018) estimates that the average R&D costs of developing a compound from discovery to launch almost doubled from 2010 to 2018.
The slowdown in pharmaceutical innovation may have started much earlier. Gordon (2016) notes that the decades between 1940 and 1970 witnessed the invention or the widespread usage of many important drugs and medical techniques (such as an array of antibiotics, computed tomographic imaging, polio vaccine, and many others), but the rate of innovation slowed down in the decades that followed. Bloom et al. (2020), provide empirical evidence that the research productivity in medical research, defined as the ratio of years of life saved to the number of publications, first increased from 1975 to the mid-1980s and then fell. These authors measure the average annual growth rate of research productivity to be -0.6 per cent for all cancers, -6.8 per cent for breast cancers, and -3.7 per cent for heart disease. The same authors show that lives saved per million in clinical trials per real dollar of research expenditure fell over the same period by a factor of eight for breast cancer research and by a factor of 16 for all cancer research. More recent research has christened “Eroom’s Law” (Eroom = Moore spelled backwards); this shows that drug approvals per billion dollars of real research expenditures declines by half every nine years. Taking the results for computers and pharmaceuticals together, they imply that 60 per cent of total manufacturing R&D expenditure is suffering from diminishing returns.
A straightforward cause of this phenomenon is that it has become increasingly challenging to improve the understanding of basic science. The lab-based process of discovering new drugs and compounds makes it challenging to predict the behavior of materials and requires multiple lab experiments which are costly, time-consuming, and unpredictable. Further, chemical companies face an increasing number of long-term disruptions in the form of more foreign competition, rapid shifts in end-market demand and a growing burden of environmental regulation.
5.3 Automobile Recalls Reduce Productivity
A higher frequency of car recalls since 2012 has reduced industry productivity growth. The cause of increasing recalls may be the increasing complexity of vehicles (Harbour et al., 2015). In addition, researchers at McKinsey conjecture that since many companies now have common product platforms and supply-chain partners, one defect on a single module can negatively affect multiple vehicle models (Aragon et al., 2019).
Auto recall services, if they cannot be carried out by dealer service departments, negatively affect car manufacturers’ productivity, since the factories have to make replacement parts, which raises labour costs and labour input for a given number of vehicles produced. Moreover, car recalls can be costly in themselves. For example, in 2016, GM recalled 23 million vehicles in the U.S. which cost GM $4.1 billion; in 2015, automakers and their suppliers together paid $17.5 billion on claims and warranty accruals (Automotive News, 2018). This issue relates to our previous comments about the persistent low reliability scores of automobiles produced by American-owned firms as tallied by Consumer Reports.
5.4 Productivity Shrinkage in the Food Industry
As shown in Figure 4 above, the food and beverage industry has recorded negative -1.5 per cent annual productivity growth since 2005. Day-Rubenstein and Fuglie (2012) argue that in recent years, new product development has been driven by consumer demand, as opposed to reducing costs or reducing resources needed for production. “An estimated 20,000 new food products are introduced in the U.S. annually. While some of these new products embody technical change, only about 10 per cent are thought to be true innovations. The average lifespan of a new food product is relatively short.”
6. A Catalog of Causes
In addition to resulting from the import invasion and a slowing of innovation, the productivity growth slowdown in U.S. manufacturing has additional causes. Further contributing factors include (1) the failure of robotics to boost productivity growth in the industries where the population of robots has expanded rapidly, (2) environmental and other government regulations, and (3) a persistent shortage of skilled labour. In this section we identify these causes and provide examples for the six industries that make the highest numerical contribution to the post-2005 productivity growth slowdown: computers, petroleum, pharmaceuticals, autos, machinery, and food. Together these six industries explain 71 per cent of the post-2005 slowdown.
6.1 Robotics and Automation
The use of robots expanded rapidly in the past 15 years in some manufacturing industries but did not prevent them from recording zero or minimal productivity growth. Why did the increase in the adoption of robotic technology fail to boost productivity growth? The first answer is the most important. Despite its continued growth, robotics accounted for only 1.1 per cent of total equipment investment expenditure in the manufacturing sector in 2021 (Annual Capital Expenditure Survey). Thus, the gains from robotics automation were swamped by other factors such as lower output demand or falling utilization or required responses to regulations, all of which tended to mask the effect of added robots.
What are the other reasons why robots have had a disappointing effect on manufacturing productivity growth? Based on the task-based model of Acemoglu and Restrepo (2019), numerous articles have shown that increased robot use raises labour productivity. Graetz and Michaels (2018) find that increased adoption of robots from 1993 to 2007 contributed 0.36 percentage points to annual labour productivity growth using panel data of seventeen countries. Acemoglu and Restrepo (2020) use the same data but focus on the U.S. labour market and find that one more robot per thousand workers reduces the employment-to-population ratio by 0.2 percentage points, which seems to match the narrative of the task-based model where automation displaces low- to middle-skill labour.
On the other hand, Benmelech and Zator (2025) find using cross-country and German administrative data that firms invest in robots when they face difficulties in finding workers and subsequently increase employment after the investment. This limits the economic impact of robots. Moreover, a significant portion of the increased robotics use is concentrated in the auto industry, which has mainly invested in robotics to drive its electric vehicle transition and respond to labour shortages (IFR, 2024). Given that the auto industry was responsible for one-third of the annual installations of industrial robots in 2024, it may be that other issues that reduce auto-industry productivity growth have offset the benefits that robots would be expected to provide.
A key challenge in automation is to ensure a smooth integration of new technologies to existing production facilities. Knoess et al. (2017), highlight that automation and robotization do not necessarily lead to productivity gains for all firms. Over the past two decades, the leading auto factories only automate “the simplest, most repetitive processes” such as the paint and body shops where they see the greatest gains from automation.
Skill shortages, which we discuss below, could partly be responsible for the unimpressive productivity impact of industrial robots in recent years. Between 2015 and 2024, the robot density defined as the number of industrial robots per 10,000 workers in the manufacturing sector almost doubled in the United States from 176 to 307, whereas China with its excess supply of STEM graduates saw a ten-fold increase from 51 to 567 within the same period (Müller, 2025). The lack of skilled workers who can manage these robots could be exerting downward pressure on the U.S. robot adoption rate.
6.2 Regulatory Burdens
Regulation changes that may impact productivity growth include tighter environmental laws, stricter pollution controls, and added safety standards. Heavy manufacturing industries such as petroleum, chemicals, and motor vehicles were most exposed to regulations that redirected capital investment or increased compliance costs. The food and beverage industry also faced tighter controls because of increased concern for public health and food safety in recent decades. In contrast the machinery and computer industries were largely unaffected by changes in regulations.
The Clean Air Act Amendment of 1990 called for the reformulation of motor fuels to reduce emissions from motor vehicles, which required firms to process gasoline with a higher percentage of oxygen. Between the late 1990s and early 2000s, EPA significantly expanded enforcement of regulations that discouraged firms from investing in new refineries or modifications to existing refineries as needed for capacity growth. The New Source Review (NSR) program, for example, required permitting before construction or modification of major stationary sources, including oil refineries, to ensure installation of pollution control equipment. NSR enforcement and interpretive uncertainty imposed both delays and cost increases on refinery projects, discouraging capacity expansion and adding permitting burden (Senate Hearing 107-868).
The Food Safety Modernization Act in 2011 was a significant shock to the regulatory framework for the food and beverage industry that changed the regime from responding to food contamination to requiring preventive measures by manufacturers. These included Hazard Analysis and Risk-Based Preventive Controls (HARPC) plans and increased inspection frequency and extra regulatory authority by the FDA. Firms responded to this change by increasing non-production labour for quality control, documentation of plans, and compliance, which would have minimal impact on output expansion. Our price-adjusted data record an output growth rate for the food industry of just 0.2 per cent per year between 2010 and 2023 while capital input increased by 2.1 per cent per year and investment grew by 3.2 per cent. This is consistent with a redirection of investment from the achievement of output and productivity growth to the compliance with regulatory requirements.
The main channel of regulatory consequences on labour productivity of the motor vehicle industry has occurred through changes in the fuel economy and emission standards. The change in the fuel economy standards imposed a binding constraint on auto manufacturers and forced them to enact engineering changes rather than complying through controlling the product mix of passenger cars and trucks. Moreover, added pollution controls required advanced catalytic converters and engine controls which increased vehicle cost and complexity and capital investment without much output effect (Wang and Miao, 2021).
The chemical industry was significantly impacted by the set of regulatory changes after 2000. Firms were required to invest heavily in end-of-pipe abatement, scrubbers, and monitoring systems. A series of papers already studied the effect of environmental regulation on manufacturing productivity. Greenstone, List, and Syverson (2012) use the 1972-1993 plant-level Census of Manufactures data to show that plants located in the non-attainment areas that faced much stricter regulation exhibited lower total factor productivity growth rates than the plants in the attainment areas. They estimate that the organic chemicals industry experienced a TFP decline of roughly 17 per cent. Shapiro and Walker (2018) show that increased regulatory burden on the manufacturing sector through pollution taxes led to abatement investment rather than productivity-enhancing technology development.
6.3 Skill Shortages
The BLS reported for 2025Q3 that more than 400,000 positions in the manufacturing sector remained open and were not filled. A survey by the National Association of Manufacturers (NAM) shows that attracting and retaining talent has been ranked as the primary business challenge consistently since 2017 (Deloitte, 2024). This shortage of skilled workers in manufacturing is not a new phenomenon. Instead, it has developed over the past two decades through the interplay of structural changes in the labour force, educational preferences biased against manufacturing jobs, and the evolving economic environment and advances in technologies.
The skill gap can be dated back to 2001, when 80 per cent of manufacturers reported a moderate to serious shortage of qualified job applicants in a survey by the NAM. This was followed by the earliest wave of retirement of skilled workers in the 2000s who entered the workforce in the hiring boom of the 1970s and 1980s (National Academies of Sciences, 2017). Their exit meant losses in tacit knowledge and skills accumulated over decades, but U.S. firms increasingly stopped training workers internally and shifted the burden of preparing occupational skill and knowledge to schools and students, which widened the skill gap even more (Cappelli, 2015). The Great Recession of 2008-09 also contributed to this trend by permanently altering the skill pipeline, as the entry-level positions disappeared and did not fully recover (Mullins and Forbes, 2015).
In part because of the aging and retirement of the skilled workforce, the supply of qualified workers stagnated. From 2011 to 2022, there was no growth in the number of associate degrees, which prepare graduates for high-skilled trades. More high school students chose to go to college instead of trade schools, as the educational system placed more weight on college attendance. The impression of manufacturing jobs as dangerous or dirty further discouraged students, though these perceptions were often misconceived or outdated (Stockman, 2025). While the supply of skilled workers has stagnated, the demand has continued to expand in response to recent advances in technology and the complexity of machinery. Overall, the difficulty of finding high-skilled workers in recent decades suggests bottlenecks and complications in production processes which contributed to the productivity growth slowdown across so many of the component industries within manufacturing.
The auto industry has been hit hardest in terms of the shortages of skilled labour, especially positions such as industrial maintenance technicians, automation and controls machinists, and tool and die makers. These occupations are difficult to fill as they require a long period of training and combine knowledge from multiple disciplines in mechanical, electrical, and software engineering. With the skill pipeline broken after the Great Recession, manufacturers in the auto industry have consistently reported difficulty in obtaining high-skilled workers for their factories. More recently, another source of skill shortage emerged from a geographic mismatch between areas where internal combustion engine vehicles manufacturing jobs are being lost and where new battery electrical vehicles manufacturing jobs are emerging, which highlights multi-faceted struggles in the search of skilled labour (Saha et al., 2025). Both petroleum and chemicals sectors rely on high-skilled plant operators who facilitate continuous-flow production, which exposes them to the skill shortage problem due to decreases in apprenticeship programs and the retirement of experienced workers. Moreover, the two industries are heavily capital-intensive and safety-constrained, hence the loss of skills in these industries often shows up as lower utilization, not lower employment. The tightened regulations and safety standards in recent years also contributed to the high demand for instrumentation and control technicians who are essential to ensure safe operation under the constraints imposed by environmental rules.
7. Conclusion
Official BEA/BLS measures show that U.S. manufacturing labour productivity growth disappeared after 2010, collapsing from +3.3 per cent per year during 1987-2010 to -0.3 per cent per year between 2010 and 2023, representing a slowdown of 3.6 per cent per year. How could a sector that had propelled American growth since the founding of the Republic stumble so badly into apparent stasis? An emerging literature has attempted to explain this slowdown by changes that occurred after 2010.
This article starts the story ten years earlier. Over the decade 2000-2010 manufacturing employment fell by 44 per cent from 17.3 to 11.5 million. The wave of imports that caused this employment evaporation was christened by David Autor and his co-authors as the “China shock”, but we refrain from using this term because over the longer period 1991 to 2023 China accounted for only 22 per cent of the increase in the ratio of imports to domestic manufacturing output. Reflecting the fact that nations worldwide have increased the penetration of imports into the U.S., we prefer the term “import invasion.”
Just as stark as the disappearance of productivity growth after 2010 was the disappearance of output growth ten years earlier. As one U.S. industry after another witnessed its sales melt in the face of import competition, the response was not just to cut employment and close plants but also to experience a squeeze on profits, a decline in capacity utilization, a decline in investment both in fixed capital and R&D, and indirectly a decline in the pace of innovation. In many cases suppliers of components moved offshore before producers of final goods, leading to emerging gaps in the domestic supply chain. While measured productivity growth during the 2000-2010 decade was the same as during 1987-2000, it occurred in a completely different industry environment. The same productivity growth that in 1987-2000 was the difference between healthy growth in output and zero growth in hours of work, instead in the 2000-10 decade was the same arithmetic difference between stagnant output and evaporating hours.
Our measure of the productivity growth slowdown makes three changes from most of the literature that uses BEA/BLS data to assess the slowdown that begins in 2010. We adjust the deflators of the BEA gross output data by incorporating into our output measures the deflator adjustments proposed by Atalay et al. (2025), to improve the treatment of quality change in existing deflators. These boost the growth rate of output and productivity in total manufacturing and a few durable goods industries, with little effect for other durables and most nondurable goods industries. The switch to these deflators does not help explain the slowdown but rather increases the puzzle, as the price adjustments boost the post-2010 manufacturing productivity slowdown from -3.6 per cent to -4.1 per cent per year.
Our second change is to switch the break date for the slowdown from 2010 to 2005, due to the unusual positive bubble of productivity growth in 2009-10 resulting from recession-caused shedding of labour. This switch in the break year reduces the magnitude of the slowdown from -4.1 per cent when dated as starting in 2010 to -3.5 per cent when the break date is 2005. We join other authors in pointing to the computer and electronic products industry as responsible for a disproportionate share of the slowdown. When measured for 18 of the 19 manufacturing industries, excluding computers, the slowdown declines from -3.5 to -2.5 per cent per year. Thus, we eliminate 39 per cent of the slowdown ((4.1-2.5)/4.1) prior to the start of our substantive analysis. While this might seem to be defining away the problem, the sources of the computer industry slowdown are better understood than for most of the remaining 18 manufacturing industries.
Another difference with some past research is that we focus on labour productivity rather than TFP. A measurement issue called “offshoring bias” leads to an understatement of growth in intermediate inputs. Since value added growth is obtained by subtracting from gross output growth the understated growth in these inputs, growth in both value added and TFP is overstated. Since the offshoring bias was most significant when imports were expanding most rapidly, this implies that the growth in TFP is overstated more before 2010 than afterwards, leading to an exaggeration of the TFP slowdown when 2010 is the break year for defining the slowdown. This source of overstatement of the slowdown is avoided in this article by limiting our attention to labour productivity growth, defined as the growth in gross output per hour.
We examine differences in the post-2005 slowdown across the 19 three-digit manufacturing industries, ranging from -12 per cent per year for computers to -0.2 per cent for wood products. For durable goods the extent of the slowdown is greatest for complex products like computers, autos, electrical equipment, and machinery, and smaller for less complex products like furniture, wood, and nonmetallic minerals. No such pattern emerges for nondurable goods, where the largest slowdowns are for the most capital-intensive industry – petroleum – and the two least capital intensive – textiles and apparel. The fact that 14 of the 19 industries experienced a post-2005 slowdown of more than -2 per cent suggests that the underlying causes of the slowdown are largely common to many industries rather than specific to each industry.
Our discussion of the import invasion establishes a causal chain between the import invasion and the post-2000 disappearance of output growth. Across the 18 industries excluding computers there is a highly significant negative correlation between the post-2000 growth of industry output and the 1987-2005 growth of that industry’s import penetration ratio. We trace a channel of causation from the arrival of imports to declining domestic sales and employment, lower profits and capacity utilization, and less investment in fixed capital and R&D.
The effect of imports on domestic innovation is more complex. Some authors point to a shift of innovation activity toward larger leading firms both inside and outside of manufacturing, in which case innovation shifts its location rather than experiencing a decline. Others argue that domestic manufacturing and innovation are complements; when production of components is offshored the growing distance from the production process inhibits further improvements that combine design and process innovation.
The computer and electronic products industry, which contributed most to manufacturing productivity growth slowdown, largely offshored production to Asia after 2005. By 2018 its import penetration ratio had reached 84 per cent. This did not occur primarily because of lower labour costs, as labour makes up only five per cent or less of manufacturing cost for most electronic products. Instead, the attraction of Asia was its emphasis on process innovation. “Manufacturing optimization” leads to the ability to ramp up production quickly at massive scale. Further explanations include government subsidies, geographically concentrated supplier clusters, and support for worker training.
The article then turns to factors that help to account for the declining contribution of innovation to productivity growth. These include a reduction in public support for R&D, and a shift in emphasis of private R&D from basic science and process improvement to brand extensions and product copying. A third factor is diminishing returns to research effort as demonstrated in recent research that “new ideas are getting harder to find.” Even though Moore’s Law in the computer industry may continue its pace to some degree, the number of research workers needed to maintain that pace has increased multifold in the last four decades. Similarly, a given number of research workers in the pharmaceutical industry produces ever fewer patents, drug approvals, and lives saved.
We emphasize the interplay between investment and regulation. Import competition reduced profits and investment directly. Beyond that regulations and other structural changes diverted investment from improving productivity to adhering to regulatory demands. Auto makers had to divert resources to raising fuel economy and convert to electric vehicles, drug makers had to wait longer for FDA approvals, the chemicals industry faced safety and anti-pollution regulations, the food industry grappled with new safety regulations, and petroleum refineries had to retool to process newly developed fracking supplies and ethanol requirements.
A separate issue involving investment was the apparent failure of the rapidly expanding robot population to boost productivity growth in the auto industry, where robots are most heavily used. One explanation is straightforward – robot investment constitutes only one to two per cent of total manufacturing equipment investment. Another involves diminishing returns – robots are already widely used in auto body and paint shops but cannot yet do sensitive assembly work requiring human hands and dexterity, particularly as electronic controls and devices make autos ever more complex.
Our introduction to this article cited increasing concern at delays and defaults in American industry more generally, from military hardware to infrastructure projects like high-speed rail. Our analysis identifies a combination of failings of government and private industry. The government has retreated from basic research and until recently has abandoned industrial policy that might have created a coordinated effort to match Asian excellence in process innovation. Private corporate research has switched from basic science to duplicative product extensions. Investment in automation and productivity-enhancing capital has been partly set aside by share buybacks and short-term profit maximization. Government and private firms have jointly failed to anticipate a growing shortage of skilled labour and have set up a comprehensive set of training and apprenticeship programs.
Finally, we return to the import invasion. To date, the literature has focused on the post-2010 decline in TFP growth. Equally important was the post-2000 disappearance of output growth. Further study is warranted about intra-industry reallocation from closed plants to more productive plants and firms to explain at least in part why productivity growth continued during the 2000-10 decade, despite the import invasion that eroded the competitiveness of American manufacturing during the same decade. The many issues addressed here support skeptics who doubt that a broad-based regime of tariffs can revive American manufacturing output, employment, and productivity growth. It may already be too late.
References
- Acemoglu D., D. Autor, D. Dorn, G. H. Hanson, and B. Price (2016) “Import Competition and the Great US Employment Sag of the 2000s,” Journal of Labor Economics, Vol. 34, No. S1, pp. S141–S198.
- Acemoglu D. and P. Restrepo (2019) “Automation and New Tasks: How Technology Displaces and Reinstates Labor,” Journal of Economic Perspectives, Vol. 33, No. 2, pp. 3–30.
- Acemoglu D. and P. Restrepo (2020) “Robots and Jobs: Evidence from US Labor Markets,” Journal of Political Economy, Vol. 128, No. 6, pp. 2188–2244.
- Aragon A., U. Huber, T. Möller, and N. Heiko (2019) “Preventing Car Recalls with a Quality Focus,” McKinsey.
- Arora A., S. Belenzon, and A. Patacconi (2017) “The Decline of Science in Corporate R&D,” Strategic Management Journal, Vol. 39, No. 1, pp. 3–32.
- Arora A., S. Belenzon, A. Patacconi, and J. Suh (2019) “The Changing Structure of American Innovation: Some Cautionary Remarks for Economic Growth,” in Innovation Policy and the Economy, Vol. 20.
- Atalay E., A. Hortaçsu, N. Kimmel, and C. Syverson (2025) “Why Is Manufacturing Productivity Growth So Low?” NBER Working Paper No. 34264.
- Automotive News (2018) “Auto Recall Bill Grew 26% to $22 Billion in 2016, Study Says.”
- Autor D. H., D. Dorn, and G. H. Hanson (2013) “The China Syndrome: Local Labor Market Effects of Import Competition in the United States,” American Economic Review, Vol. 103, No. 6, pp. 2121–2168.
- Autor D., D. Dorn, G. H. Hanson, G. Pisano, and P. Shu (2020) “Foreign Competition and Domestic Innovation: Evidence from US Patents,” American Economic Review: Insights, Vol. 2, No. 3, pp. 357–374.
- Azoulay P., E. Fuchs, A. P. Goldstein, and M. Kearney (2019) “Funding Breakthrough Research: Promises and Challenges of the ARPA Model,” Innovation Policy and the Economy, Vol. 19, pp. 69–96.
- Bena J. and E. Simintzi (2025) “Machines Could Not Compete with Chinese Labor,” Review of Finance, Vol. 29, No. 6, pp. 1619–1661.
- Benmelech E. and M. Zator (2025) “Robots and Firm Investment,” Journal of Financial Economics, Vol. 174, Article 104183.
- Bernard A. B., J. B. Jensen, and P. K. Schott (2006) “Survival of the Best Fit,” Journal of International Economics, Vol. 68, No. 1, pp. 219–237.
- Bloom N., C. I. Jones, J. Van Reenen, and M. Webb (2020) “Are Ideas Getting Harder to Find?” American Economic Review, Vol. 110, No. 4, pp. 1104–1144.
- Bloom N., M. Draca, and J. Van Reenen (2016) “Trade Induced Technical Change?” Review of Economic Studies, Vol. 83, No. 1, pp. 87–117.
- Byrne D. M., J. G. Fernald, and M. B. Reinsdorf (2016) “Does the United States Have a Productivity Slowdown or a Measurement Problem?” Brookings Papers on Economic Activity, Vol. 1, pp. 109–182.
- Byrne D. M., A. Hamins-Puertolas, and M. M. Harnish (2023) “Transistors All the Way Down: Viability of Direct Volume Measurement (and Price Indexes) for Semiconductors,” Working Paper.
- Cappelli P. H. (2015) “Skill Gaps, Skill Shortages, and Skill Mismatches,” ILR Review, Vol. 68, No. 2, pp. 251–290.
- Chittoor R., P. Pietraru, and A. Sharpe (2025) “The Stylized Facts of the United States Manufacturing Productivity Slowdown,” CSLS Research Report.
- Covarrubias M., G. Gutiérrez, and T. Philippon (2019) “From Good to Bad Concentration?” in NBER Macroeconomics Annual, Vol. 34.
- Day-Rubenstein K. and K. Fuglie (2012) “R&D and Productivity Lag in Food Manufacturing,” USDA Economic Research Service.
- Decker R. A., J. Haltiwanger, R. S. Jarmin, and J. Miranda (2016) “Declining Business Dynamism,” Hutchins Center Working Paper No. 23.
- Dedrick J., K. L. Kraemer, and G. Linden (2010) “Who Profits from Innovation in Global Value Chains?” Industrial and Corporate Change, Vol. 19, No. 1, pp. 81–116.
- Deloitte and The Manufacturing Institute (2024) Talent Study.
- Feenstra R. C. and D. E. Weinstein (2017) “Globalization, Markups, and US Welfare,” Journal of Political Economy, Vol. 125, No. 4, pp. 1040–1074.
- Fernald J. G. (2015) “Productivity and Potential Output Before, During, and After the Great Recession,” in NBER Macroeconomics Annual, Vol. 29, No. 1, pp. 1–51.
- Food and Drug Administration (2015) “FSMA Final Rulemaking for Current Good Manufacturing Practice.”
- Gordon R. J. (1990) The Measurement of Durable Goods Prices. Chicago: University of Chicago Press.
- Gordon R. J. (2016) The Rise and Fall of American Growth. Princeton: Princeton University Press.
- Gordon R. J. and Sayed (2024) “New Perspectives on Productivity Dynamics in the U.S. Private Economy, 1950–2023,” CEPR Discussion Paper No. 19569.
- Graetz G. and G. Michaels (2018) “Robots at Work,” Review of Economics and Statistics, Vol. 100, No. 5, pp. 753–768.
- Greenstone M., J. A. List, and C. Syverson (2012) “The Effects of Environmental Regulation on Manufacturing Productivity,” MIT Working Paper.
- Gruber J. and S. Johnson (2019) Jump-Starting America.
- Gutiérrez G. and T. Philippon (2017) “Investment-less Growth,” Brookings Papers on Economic Activity, Vol. 48, No. 2, pp. 89–190.
- Gutiérrez G. and T. Philippon (2020) “Some Facts about Dominant Firms,” NBER Working Paper No. 27985.
- Harbour R., M. Hill, and J. Schmidt (2015) “The Harbour Report,” Oliver Wyman.
- Houseman S., C. Kurz, P. Lengermann, and B. Mandel (2011) “Offshoring Bias in US Manufacturing,” Journal of Economic Perspectives, Vol. 25, No. 2, pp. 111–132.
- International Federation of Robotics (2024) “U.S. Companies Invest Heavily in Robots.”
- Ji K., L. Nauta, and J. Powell (2023) “Mapping Global Supply Chains: The Case of Semiconductors,” RaboResearch.
- Jibrell A. (2018) “Auto Recall Bill Grew 26% to $22 Billion in 2016,” Automotive News.
- Kim M. (2019) “Does Import Competition Reduce Domestic Innovation?” International Productivity Monitor, No. 37, pp. 72–95.
- Knoess C., R. Harbour, and S. Scemama (2017) “Prepare Your Workforce for the Automation Age,” Harvard Business Review.
- Lazonick W. (2014) “Profits without Prosperity,” Harvard Business Review, Vol. 92, No. 9, pp. 46–55.
- Melitz M. J. (2003) “The Impact of Trade on Intra-Industry Reallocations,” Econometrica, Vol. 71, No. 6, pp. 1695–1725.
- Mullins J. and B. E. Forbes (2015) “CES Employment Recovers in 2014,” Monthly Labor Review.
- National Academies of Sciences (2017) Building America’s Skilled Technical Workforce.
- New York Times Editorial Board (2025) “America Can’t Make What It Needs for Its Defense,” New York Times, December 14.
- Pierce J. R. and P. K. Schott (2017) “Investment Responses to Trade Liberalization,” NBER Working Paper No. 24071.
- Saha D., R. Shrestha, N. Hunt, and E. Kim (2025) “How US Auto Workers Can Thrive in the Transition to Battery Electric Vehicles,” World Resources Institute.
- Shapiro J. S. and R. Walker (2018) “Why Is Pollution from US Manufacturing Declining?” American Economic Review, Vol. 108, No. 12, pp. 3814–3854.
- Schott P. K. (2008) “The Relative Sophistication of Chinese Exports,” Economic Policy, Vol. 23,
No. 53, pp. 6–49.
- Stockman F. (2025) “Why Factories Are Having Trouble Filling Jobs,” New York Times.
- Terry C. and N. Lesser (2018) “Unlocking R&D Productivity,” Deloitte Centre for Health Solutions.
- U.S. Census Bureau (2021) “Annual Capital Expenditures for Robotic Equipment.”
- U.S. Congress (2002) Senate Hearings on New Source Review Policy.
- Xu R. and K. Gong (2017) “Does Import Competition Induce R&D Reallocation?” IMF Working Paper.
- Wang Y. and Q. Miao (2021) “The Impact of Corporate Average Fuel Economy Standards,” Resource and Energy Economics, Vol. 63, Article 101211.
Footnotes
- Labour productivity is gross output from the BEA National Income and Product Accounts “GDP by Industry” tables and hours are from the BLS productivity table “Total Factor Productivity by Major Industries.” The output data are subsequently adjusted below for alternative price deflators.
- The 2000-23 annual growth rate of manufacturing output in the BEA data is -0.05 per cent.
- Chad Syverson kindly provided detailed annual price change adjustments by industry for 1998-2023. We extended these by applying the average adjustment from 1998-2005 uniformly to each year between 1988 and 1997.
- Byrne’s papers provide suggested corrections to BEA deflators for industry 334 for three time intervals: 1978-95, 1995-2004, and 2004-14. We have extended his suggested bias corrections to 2023; details of this translation are provided in the Data Appendix.
- Table 1 that follows compares the two alternative series.
- For total manufacturing productivity growth slows from 5.1 to 1.6 per cent, for a slowdown of 3.5 per cent per year. With computers excluded those three numbers are 3.5, 1.0, and 2.5. The computer contribution is ((3.5-2.5)/3.5) or 29 per cent.
- The IP ratio (IM/(IM+GO)) is not redundant and is useful in an industry like apparel where domestic sales consisted of 3 per cent domestic production and 97 per cent imports. In this example the IP ratio is 97 per cent whereas the IR of 97/3, or 3200 per cent, is a ratio that is intuitively meaningless.
- These percentages come from our data file on price-adjusted gross output for the 19 individual industries. See the Data Appendix.
- Consumer Reports magazine in its 2025 automobile quality and reliability rankings awards the top 5 places to Japanese and Korean brands, with cars made by American firms perennially relegated to the bottom of the list.
Abstract
With the advent of generative artificial intelligence (GenAI), the scope of AI has increased dramatically, but its effect on labour productivity remains uncertain. Some innovations raise labour productivity growth as adoption spreads but the effect fades when the market is saturated. In contrast, two types of innovation — general purpose technologies (GPTs) and inventions in the method of invention (IMIs) — have long-lasting effects on productivity growth. GPTs (1) are widely adopted, (2) spur knock-on innovations, and (3) show continual improvement, refreshing the innovation cycle. IMIs increase the efficiency of the research and development process via improvements to observation, analysis, communication, and organization. We conclude there is suggestive evidence that GenAI is both a GPT and an IMI, a sign that its adoption will lead to higher labour productivity growth in the future.
1. Introduction
In late 2022, OpenAI grabbed the world’s attention with ChatGPT, a generative artificial intelligence (GenAI) program that uses a computer model of human discourse to respond to natural-language questions (Figures 1-1 and 1-2). The scope of AI expanded dramatically with the advent of GenAI, including to tasks previously seen as quintessentially human, such as competition-level mathematics (Figure 2). Indeed, more and more challenging benchmark tests have been needed to assess the technology’s progress, as GenAI has matched human performance on one task after another. In another encouraging sign, field test evidence of productivity improvements from GenAI in practical applications has emerged, notably for writing, computer programming, and responding to call center inquiries. We supplement the quantitative evidence with a qualitative assessment of the properties of GenAI, with a view to helping to predict its impact.1
We focus on two particularly impactful types of innovation. Unlike discrete innovations that temporarily raise productivity growth as adoption spreads, “general purpose technologies” (GPTs) and “inventions in the method of invention” (IMIs) have longer-lasting growth effects. GPTs are widely adopted, spur knock-on innovations — new products, process improvements, and business reorganization — and refresh this adoption cycle through ongoing improvement in the core technology (Lipsey et al., 2005). IMIs yield a sustained increase in productivity growth by lowering the cost of research and development (Whitehead, 1925). We conclude there is suggestive evidence that GenAI is both a GPT and an IMI, a sign that its adoption will lead to higher labour productivity growth in the future.2
2. GenAI as a General Purpose Technology
The future productivity impact of GenAI will depend on whether (1) it is widely adopted, (2) it spurs related innovations, and (3) the technology continues to improve. These are the three distinguishing features of GPTs.
2.1 Diffusion
Analysis of job descriptions suggests that AI can be used for a broad range of workplace tasks, indicating high potential for diffusion and rising use of AI (Eloundou et al., 2024).3 We review evidence that this is taking place. Although few of these indicators are restricted to GenAI, the timing of their increases is consistent with GenAI driving adoption upward. The level of AI use varies across sources and depends on the meaning one uses for adoption.
Large-scale firm surveys from the U.S. Census Bureau and McKinsey provide rather different pictures of adoption at first glance (Figures 3-1 and 3-2). The Census Bureau’s Business Trends and Outlook Survey (BTOS) found that roughly 17 per cent of firms used AI (GenAI and other types of AI) as of March 2026.4 In contrast, McKinsey reported that 88 per cent of firms did so in November 2025. Differences in survey coverage likely explain much of the gap. The BTOS is a representative sample of 200,000 U.S. firms, only a handful of which are large corporations. In contrast, the McKinsey survey is a convenience sample with heavy representation from large corporations (McKinsey, 2024). That is, large firms appear to use AI far more than small firms.
Surveys of workers suggest significant AI adoption with relatively few adopters reporting frequent use. Gallup, Inc. reports 50 per cent of U.S. workers had used AI at work as of the fourth quarter of 2025, though only 13 per cent of respondents used it daily. Pew Research Center reports that 21 per cent of U.S. workers used AI for at least some of their work in September 2025. Bick, Blandin, and Deming (2024) ask specifically about GenAI and find nearly 40 per cent of workers used it in 2024. As new workers enter the labour force, these numbers are expected to rise. The Pew poll finds that 64 per cent of teens have used an AI chatbot and more than half of them have used them to search for information and to get help with schoolwork.
AI use varies significantly across industries. Both the BTOS and the McKinsey survey show that use is particularly high in the information sector, where computer coding is prevalent. While our focus in this article is not the labour market, we note two indicators of the disruption caused by AI in the information sector. Data from Lightcast show that the share of job postings in the information sector mentioning AI and related skills was 31 per cent in May 2026, up from 10 per cent in 2021, and far higher than the average across all sectors of 7 per cent (Figure 4). Crane and Soto (2026) provide evidence that labour demand growth for computer coders slowed noticeably following the release of ChatGPT.5
Kane and Baily (2025a,b) provide industry case studies summarizing the evidence of GenAI adoption in four sectors — information, healthcare, finance and electricity generation and distribution. In some examples, such as computer coding, GenAI has been adopted quickly, and in all these sectors companies were experimenting with ways to cut costs using GenAI. There are often barriers to adoption, however, including regulation, skill shortages, and high adoption costs. In other cases, efforts to use GenAI have proven disappointing so far.
2.2 Knock-on Innovation
Knock-on innovations related to GenAI include novel and improved software, more efficient product and process design systems, and organizational changes to better exploit GenAI capabilities.
A prominent example of knock-on innovation is ChatGPT itself, a user interface (UI) for OpenAI’s GenAI models. UIs provide a channel through which requests and responses can pass between the GenAI model and human users. ChatGPT, released in 2022, is a conversational interface that made GenAI interactions significantly more accessible relative to early approaches that relied on Python programs or websites such as the OpenAI Playground. In 2023, OpenAI introduced custom GPTs, enabling users to create domain-specific large language models (LLMs), such as LegalGPT for legal matters (OpenAI, 2023). In 2024, OpenAI announced integration of their ChatGPT model to Apple’s Siri voice assistant and Google launched NotebookLM, which made it easy to upload documents and transform them into interactive discussions (Johnson, 2024). In addition, there are “copilots” that integrate AI into existing user workstreams, notably GitHub Copilot (computer programming) and Microsoft 365 Copilot (office productivity).
System interfaces are another key locus of knock-on innovation for GenAI. These allow hardware and software systems to access the AI model. For example, Nvidia’s Isaac Software Development Kit (SDK) facilitates the integration of AI into robotics. Access to AI through the SDK helps the robot with environmental integration problems, such as simultaneously tracking its location and mapping its environment. Development of multimodal models — which can take in inputs of different kinds (text, images, sensor readings) and output instructions to the robot, such as the rotation and torque for a joint — has pushed robot-AI integration forward (Reed et al., 2022; Brohan et al., 2023). System interfaces also enable the design of agentic AI systems, which collect information during operation, interpret context, make decisions and act autonomously to pursue goals (Park et al., 2023). Innovations in production line operations have followed GenAI advances as well. Serradilla et al. (2022) provide an overview of the use of deep learning, including GenAI such as generative adversarial networks, to optimize line configuration, throughput, efficiency, and carbon footprint. Predictive maintenance using synthetic data and scenario simulation is another application for GenAI in industry.
Another area of knock-on innovation has been the creation of AI agents. Agentic AI systems develop strategies to pursue broad goals and recalibrate in response to their environment, in contrast to tool-based AI, which has a stable structure and calibration, and is only equipped to respond to carefully crafted requests. For example, specialized agents can handle health care paperwork including making appointments, following up on treatment protocols and submitting insurance claims. In software development, agentic tools have extended the copilot approach further. Tools such as Anthropic’s Claude Code allow programmers to delegate command-line coding tasks, such as debugging, refactoring, and test execution, with the agent reading and modifying files autonomously rather than suggesting individual lines of code.
2.3 Core Innovation
Importantly, labour productivity (economic performance, as opposed to benchmark performance) only rises when more can be accomplished while holding input costs fixed. Accordingly, we focus below on (a) how innovations in model architecture raise GenAI model capabilities without raising training costs, (b) how hardware innovations lower the cost of computation, and (c) how richer datasets can be brought to bear on training.
2.3.1 Model Development, Training, and Deployment
Early in the development of modern GenAI, advances in performance were attained primarily by increasing model scale (number of parameters), computational power, and training data (Kaplan et al., 2020). That is, output (benchmark performance) was increased by adding more inputs (Figure 5). For example, GPT models had 117 million parameters in 2018 (GPT-1) and as many as 175 billion in 2020 (GPT-3) (Shree, 2020). More recently, increasing attention has been given to using these inputs more efficiently. These efficiency gains appear in four distinct stages: leveraging insights into algorithm design to make better models, improving model pre-training, fine-tuning of those models, and strategies to reduce the cost of inference (running the deployed models).
The Transformer, which enables GenAI to efficiently pay attention to context when interpreting text, was the seminal algorithmic innovation for modern GenAI (see Box 1). Further progress on this “attention mechanism” has followed. An example is Mamba (Gu and Dao, 2023). In the original transformer, computational burden is proportional to the square of the number of parameters; Mamba achieves sub-quadratic costs using a state-space model. Other innovations have focused on what can be achieved with smaller scale models; models from Microsoft and Mistral AI have shown strong performance relative to their size (Jiang et al., 2023; Abdin et al., 2024). Open-source model development has played a central role in this process.
Box 1: The Transformer
The transformer architecture, introduced by Vaswani et al. (2017), was a game-changer in AI, particularly as the engine behind GenAI models. Its key innovation, the “attention mechanism,” steers models to focus selectively on relevant parts of the prompt, enabling more efficient and accurate processing of language. This breakthrough has powered major advancements in natural language understanding, translation, and generation, forming the backbone of today’s most advanced GenAI systems.
Transformers process input data through a series of layers (steps), each consisting of an attention mechanism followed by a multilayer perceptron (MLP, defined below), proceeding as follows.
First, a representation of the prompt (input text) suitable for analysis by the model is created. Specifically, the prompt is broken into tokens (smaller pieces which may be phrases, words, or parts of words). The tokens are converted into embeddings (numerical vector representations) which encode the semantic and syntactic meaning of each token. Loosely speaking, for each token, the closest of the other tokens, as measured by the distance between their embeddings, are the ones most important to understanding its meaning.
Second, the attention mechanism processes the matrix of token embeddings using three large matrices called the “query,” the “key,” and the “value.” For each token in the input, the query is compared to the keys of all tokens to compute attention scores, which are used to form a weighted average of values. This step allows each token’s representation to incorporate information from other tokens in the prompt based on their contextual relevance.
Third, the data passes through an MLP, a type of neural network. While the attention mechanism focuses on pairwise interactions between tokens, the MLP applies nonlinear functions (in contrast to the linear attention mechanism) in refining the token representations.
This sequence—of computing the attention mechanism followed by the MLP—is repeated multiple times depending on how many layers are in the model (for example, the Llama-3 model has 32 layers), enabling the model to capture increasingly abstract features of the input text.
The performance gains from scaling of this system through increasing the size of these matrices—along with larger training datasets and improvements in hardware and processing algorithms—underpins the rising ability to handle complex language tasks.
Pre-training brings algorithms to a dataset to produce a broadly applicable “foundation model.” Between 2018 and 2022, a key pre-training tactic in the effort to improve GenAI performance was to increase model size. Remarkably, algorithmic innovation has more than offset the resulting increase in computational complexity: the cost of training a model of a given size was halved approximately every eight months through 2024 (Ho et al., 2024). This focus on scale abated to some degree over time: by 2022, diminishing returns to model size for foundation models had appeared and researchers have increasingly explored performance improvements in fine-tuning and inference (Zeff, 2024).
Fine-tuning refines the foundation model for a specific application. Fine-tuning innovations have included transfer learning (adapting an already fine-tuned model to a related task with domain-specific data), instruction tuning (guiding the model to recognize instructions, not just predict the next word; Taori et al., 2023), and reinforcement learning from human feedback (aligning the model outputs with human preferences; Christiano et al., 2017; Ouyang et al., 2022). Once pre-trained and fine-tuned, the model is used in inference (responding to user requests). The aggregate cost of GenAI inference — in terms of electricity, time, computation, and carbon emissions — has risen with the popularity of GenAI, leading to a focus on techniques to make this step more efficient.6
Conversely, some recent models have deliberately extended inference time to improve performance with such techniques as chain-of-thought reasoning (Wei et al., 2022). A salient example of the cumulative effect of these innovations is DeepSeek R1, released in January 2025, which blended several of these approaches, including MoE, chain-of-thought reasoning, and reinforcement learning and distillation, to achieve frontier-level performance at a fraction of the cost of comparable models (DeepSeek-AI, 2024).
2.3.2 Hardware
In addition to the software and operational choices described above, GenAI model training and inference costs rely critically on the state of electronic hardware. Because the workloads generated by GenAI training are best handled with massive parallel computation, graphics processing units (GPUs), which are designed for parallel processing, play a central role.7 Successive GPUs released by NVIDIA have delivered leaps in AI performance through improvements in processing core (CUDA) design, the addition of on-chip tensor cores, which accelerate matrix calculations, and massive amounts of high-speed integrated memory. In addition to these circuit design innovations, hardware cost improvement depends on advances in basic and applied science that permit greater miniaturization and power-efficiency for electronics.8 While the engineering performance of leading-edge GPUs has rocketed upwards in recent years, prices have increased dramatically as well, but by less than performance: In 2007, a $349 GPU provided 0.3 teraflops (TFLOPS) of compute and in 2024, a $299 GPU delivered 15.1 TFLOPS, implying an average annual rate of price decline of 24 per cent that persisted for 17 years (Figure 6). This example is representative of a broader trend.
More recently, NVIDIA’s Blackwell GPU architecture, introduced in 2024, roughly quadrupled the inference throughput of LLMs (tokens per second) at comparable power consumption, relative to prior models like the Hopper. Such hardware gains amplify the algorithmic efficiency improvements described above for training as well. Given that agentic AI systems involve long, multi-turn interactions in which input text is reused across steps, these types of gains are particularly consequential for the rise of agents discussed in Section 2.2, where inference costs rather than training costs are binding constraints on adoption.
2.3.3 Datasets
GenAI models “learn” by adjusting parameters to best represent the content of large amounts of text, allowing them to choose the word that should appear next in response to a user’s prompt. Figure 5 illustrates the increase over time in the size of the datasets used in training and the associated improvement in (benchmark) performance. A crucial nuance to this aspect of model improvement is that access to more information, not more text, is needed to continue to improve GenAI models. Diminishing marginal returns set in as developers move from information-rich content, such as Wikipedia and scientific articles to noisier text like social media posts.
One approach to mitigating the content constraint is transfer learning, where a model pre-trained with public data is improved by further training using proprietary data. Another approach is data augmentation, such as incorporating small, localized modifications of the training data. For example, the performance of an image recognition model may be improved by supplementing the training set of labeled images with their mirror images.9 “Synthetic data”, where generative models create new data to emulate patterns and characteristics of real data has been explored as well (Liu et al., 2024).10 Last, datasets can be augmented by harvesting information collected with sensors, particularly in physical environments such as industrial robots and autonomous vehicles (Feng et al., 2019).
3. GenAI as Invention in the Method of Invention
Like other sectors, efficiency in the research sector can be increased using appropriate capital, such as inventions in the method of invention (IMI). We consider below whether GenAI is such an invention and whether it can contribute to research productivity beyond what is contributed by predecessor AI technologies. We then review broad indicators of AI’s role in research: patent filings, the share of AI use by workers in research roles, and new evidence on AI references in company conference calls.
Eloundou et al. (2024) note that “scientists and researchers” and “technologists” are the job groups most highly exposed to LLMs, suggesting substantial potential for research and development (R&D) productivity enhancement from GenAI. Prior to GenAI, AI had already diffused widely across scientific disciplines and improved research efficiency (Carobene et al., 2024). Cockburn, Henderson, and Stern (2019; 2023) note that pre-generative AI assists with the “labour-intensive search with high marginal cost of search” involved in many types of R&D. Agrawal et al. (2018), emphasize that AI improves prediction, which plays a central role in research; for example, machine learning has also been used extensively for predicting the properties of novel metal alloys, economizing on physical experimentation and computer simulations (Hart et al., 2021). Our focus is on the question of whether GenAI enables additional efficiencies in R&D beyond these and other improvements provided by machine learning. We group IMIs into enhancements to observation, analysis, communication, and organization.
3.1 Observational
Observational tools, such as microscopes, telescopes, and cameras are central to scientific advance (Mokyr, 2004). These tools are invariably limited in that they produce imperfect data due to defects in their components and variation in the environment. GenAI provides a tool to enhance imperfect portions of data. For example, generative techniques for image enhancement perform better than techniques, such as splines, relying solely on smoothness assumptions (i.e., that nature does not make leaps) (Liu et al., 2018; Lugmayr et al., 2022). GenAI can approximate the manifold of the data generating process, implicitly accounting for the actual physics, say, of a remote galaxy seen through an imperfect lens. More generally, imputation of missing observations in datasets of all kinds is possible in a fashion consistent with the apparent properties of the underlying phenomena.
3.2 Analytical
GenAI can be used as an analytical tool as well. Caliskan, Bryson, and Narayanan (2017), for example, find that “text corpora contain recoverable and accurate imprints of our historic biases.” This new visibility may promote analysis of previously intractable social science questions. There has been an explosion of sentiment analysis and other forms of natural language processing in recent years fueled by this capability of GenAI.11 While the identification of underlying sentiment (encoding) is strictly speaking, a function of the LLM, conveying the discovered sentiment to the user is necessarily a generative process. Korinek (2023) documents a variety of potential roles for GenAI in the economic research process; that GenAI may play a similar role in many other fields is a reasonable conjecture.
3.3 Organizational
The organization of science may benefit from the use of GenAI. Institutional organization plays a central role in the effectiveness of R&D (Mowery and Rosenberg, 1999), as do informal associations into professional networks (Wang and Barabasi, 2021) and geographic clusters (Porter and Stern, 2001). Consequently, the method of invention for any given research program properly includes the institutions involved. Emerging applications of AI “digital twins” offer the prospect of R&D with a reduced institutional footprint in many areas of study. Among these are drug discovery (Bordukova et al., 2024), industrial research (Tao, Zhang, and Zhang, 2024), and materials science (Kalidindi et al., 2022). GenAI tools can help with applied science as well, such as designing products that meet technical and aesthetic specifications. Moreover, the design process itself can be transformed to create a range of options, not just one-off designs, together with detailed manufacturing specifications (Saadi and Yang, 2023).
3.4 Communication
Perhaps most obviously, GenAI is a communication tool. Although empirical and analytical stages of research projects focus on measurement and calculation, many aspects of the research process involve manipulating language. GenAI may be employed in the writing tasks involved in the conceptual, planning, and dissemination stages of research projects, such as drafting literature reviews, grant applications, and seminar slides. Whether GenAI improves the efficiency of such tasks on net, once the effort needed for review and editing of the documents drafted by GenAI is accounted for, is an open question. If so, GenAI may play a similar role to the printing press and word processing as a catalyst to the invention process.
3.5 Indicators of GenAI Research and of GenAI Use in Research
Substantial suggestive evidence has emerged that GenAI has enhanced research performance. AI-related patents issued by the United States Patent and Trademark Office (USPTO) increased following the advent of GenAI, suggesting a related surge in GenAI research (Figure 7) (Pairolero, 2025). The USPTO index of AI-related patents began climbing in 2018, shortly after the publication of the seminal paper by Vaswani et al. (2017) quickly reaching a level 50 per cent higher, which it has sustained since 2019. We also observe that increases in patent activity for AI modalities particularly related to GenAI — natural language processing, vision, speech, and knowledge processing — have risen even further. This suggests that the recent surge in patenting activity is not merely a reflection of advancements in machine learning.
Handa et al. (2025) provide a rich set of information on GenAI use in their Anthropic Economic Index (AEI), assigning millions of conversations from Claude (Anthropic’s premier GenAI system) to roughly 3,500 of the tasks defined by the U.S. Department of Labor’s O*NET Dataset. Table 1 shows the estimated share of prompts accounted for by occupational groups, their employment share, and the ratio of the two. (If prompts were equally distributed across all workers, these ratios would each be equal to 1.) “Computer and mathematical occupations”, which includes the computer programmers for whom GenAI use is especially intense, have the highest ratio of prevalence of GenAI use to occupational prevalence and use intensity is nearly as high among scientists. Other occupational groups with high relative prevalence of GenAI use include “arts, design, sports, entertainment and media”; “architecture and engineering”; and “educational instruction and library”. The remaining 87.6 per cent of employment is accounted for by occupations which AEI found had a share of Claude prompts roughly equal to or lower than their share of employment, highlighting the concentrated nature of GenAI adoption in the economy at present.
Figure 8 illustrates significant automation and augmentation of tasks among our groupings of research occupations: programmers exhibit the highest automation rate, with over half of the requests handled by GenAI being automation tasks. Social science researchers show slightly lower automation rates, with economists showing over 23 per cent of their prompts being automation focused. Notably, for hard science researchers (e.g., physicists, biochemists), the share of their GenAI use for automation is nearly 15 per cent higher than their natural science counterparts. This difference likely reflects AI’s strength in data-intensive and simulation-based research such as those found in hard sciences like physics and materials science.
Firm communication also reveals GenAI’s integration into the invention process. Figure 9 plots the number of firms referencing AI in the context of research, as indicated by the firms mentioning an AI-specific term (“machine learning,” “deep learning,” “artificial intelligence,” “GenAI”, or “generative AI”) within a research-related context (within 10 words of “inventi-”, “research-”, or “discover”). A sudden rise appears in 2023, with approximately 60 public companies per quarter mentioning such usage. This increased integration of AI with R&D illustrates the role it plays in corporate innovation.
4. Tailwinds and Headwinds for Productivity Growth from GenAI
The qualities of GenAI and the limited evidence on its application suggest that two substantial tailwinds support a forecast of a noteworthy increase in productivity from the technology. GenAI has features typical of both a GPT — headed toward being widely used, stimulating related innovation, and displaying ongoing improvement in (economic) performance — and an IMI — raising the efficiency of R&D through improvements to observation, analysis, communication, or organization. Because both GPTs and IMIs promote productivity growth for extended periods, it is reasonable to expect GenAI will have a noteworthy impact on productivity. That being said, we note several headwinds that should be taken into account.
First, whether the organizational change needed for GenAI to be a true GPT will take place is an open question. AI systems that preceded GenAI demonstrated the need for cross-functional teams with access to data that spans the enterprise, breaking down barriers between business units, optimizing supply chains, and reallocating employees to de-emphasize repetitive writing tasks (Iansiti and Lakhani, 2020). Bresnahan (2024) observed that adoption was concentrated in places where complementary innovation was less necessary, such as in firms that were highly digitized from their founding. These digital natives will surely lead the charge for GenAI as well. For other firms, the pace and success of reorganization innovation will be a key determinant of the scale and timing of productivity effects from GenAI.
Relatedly, the reliance of GPTs on complementary investment tends to damp the effect on labour productivity growth. For example, the effect on the productivity level of solid-state computing was large, but it played out over decades. Massive advances in computational technology, including the invention of the solid-state transistor and the fundamentals of system design had accumulated by the end of the 1940s and a steady decline in computing costs had begun (Nordhaus, 2007). The surge in productivity attributed to information technology arrived some fifty years later.
Third, investment to develop and deploy new technologies is fraught with risk. If GenAI is a widely adopted “killer app” that defines a new era of IT, the computing capacity needed to deliver GenAI to millions of simultaneous users will be massive. Anticipation of this outcome helps explain the recent wave of irreversible investment in data centers and power generation (Figure 10). Historically, when such forecasts have proven wrong, the negative consequences of the resulting capital overhang have been substantial.
Fourth, the scope of application of GenAI as an IMI remains to be seen as well. For example, whether GenAI can uncover fundamental features of phenomena is a matter of some debate. Li et al. (2022) present evidence that GenAI does develop such knowledge in an “emergent world model.” Others argue that GenAI is employing a “bag of heuristics.”12 This question is a crucial one in determining the capabilities of GenAI to contribute to science. Without a model of underlying structure, one cannot articulate fundamental laws. This limitation may be inherent to how GenAI is trained: humans learn scientific fundamentals from textbooks, but such laws may not form the rhetorical backbone of the verbal exchanges that dominate training corpora.
Fifth, we expect that GenAI will boost productivity growth relative to the counterfactual economy without it, but the growth effect of machine learning (and other IT innovations) may be waning. The impact of GenAI will have to match the impact of machine learning for the economy simply to match the recent history of productivity growth. In other words, the digital revolution may be baked into the productivity trend and GenAI is just its latest form.
5. Conclusion
The release of ChatGPT in late 2022 was a stark inflection point in public interest in GenAI and predictions of a first-order impact on productivity in the future soon followed, but its economic effects remain uncertain. To complement the limited empirical evidence, we ask what the characteristics of GenAI suggest its future impact on productivity may be. We conclude there is strong evidence that GenAI has the potential to be both a GPT and an IMI. We therefore expect a noteworthy increase in labour productivity from GenAI, though the headwinds we cite suggest the range of plausible outcomes is wide with respect to both the magnitude and timing of the increase.
References
- Abdin, M., J. Aneja, H. Awadalla, et al. (2024) “Phi-3 Technical Report: A Highly Capable Language Model Locally on Your Phone,” arXiv Preprint arXiv:2404.14219. Available at: https://arxiv.org/abs/2404.14219.
- Acemoglu, D., D. Autor, J. Hazell, and P. Restrepo (2020) “AI and Jobs: Evidence from Online Vacancies,” NBER Working Paper 28257, National Bureau of Economic Research.
- Acemoglu, D. and P. Restrepo (2020) “The Wrong Kind of AI? Artificial Intelligence and the Future of Labour Demand,” Cambridge Journal of Regions, Economy and Society, Vol. 13, No. 1, pp. 25–35.
- Agrawal, A., J. Gans, and A. Goldfarb (2018) Prediction Machines: The Simple Economics of Artificial Intelligence, Harvard Business Review Press, Boston.
- Alemohammad, S., J. Casco-Rodriguez, L. Luzi, A.I. Humayun, H. Babaei, D. LeJeune, A. Siahkoohi, and R. Baraniuk (2023) “Self-consuming Generative Models Go Mad,” in The Twelfth International Conference on Learning Representations.
- Baily, M.N., D.M. Byrne, A.T. Kane, and P.E. Soto (2025) “Generative AI at the Crossroads: Light Bulb, Dynamo, or Microscope?” Working Paper, Center on Regulation and Markets, Brookings Institution.
- Baily, M.N. and A. Kane (2025a) “AI in the Finance Sector: Transforming Productivity and Risk Management,” Brookings Institution.
- Baily, M.N. and A. Kane (2025b) “AI in the Healthcare Sector: Enhancing Care, Efficiency, and Innovation,” Brookings Institution. Available at: https://www.brookings.edu/articles/harnessing-ai-for-economic-growth/.
- Bick, A., A. Blandin, and D.J. Deming (2024) “The Rapid Adoption of Generative AI,” NBER Working Paper 32966, National Bureau of Economic Research.
- Bonney, K., C. Breaux, C. Buffington, E. Dinlersoz, L. Foster, N. Goldschlag, J. Haltiwanger, Z. Kroff, and K. Savage (2024) “Tracking Firm Use of AI in Real Time: A Snapshot from the Business Trends and Outlook Survey,” NBER Working Paper 32319, National Bureau of Economic Research.
- Bonney, K., C. Breaux, E. Dinlersoz, L. Foster, J. Haltiwanger, and A. Pande (2026) “The Microstructure of AI Diffusion: Evidence from Firms, Business Functions, and Worker Tasks,” NBER Working Paper 35141, National Bureau of Economic Research.
- Bordukova, M., N. Makarov, R. Rodriguez-Esteban, F. Schmich, and M.P. Menden (2024) “Generative Artificial Intelligence Empowers Digital Twins in Drug Discovery and Clinical Trials,” Expert Opinion on Drug Discovery, Vol. 19, No. 1, pp. 33–42.
- Bresnahan, T. (2019) “Artificial Intelligence Technologies and Aggregate Growth Prospects,” in J.W. Diamond and G.R. Zodrow (eds.), Prospects for Economic Growth in the United States, Cambridge University Press, Cambridge, England, pp. 132–172.
- Bresnahan, T. (2024) “What Innovation Paths for AI to become a GPT?” Journal of Economics & Management Strategy, Vol. 33, No. 2, pp. 305–316.
- Brohan, A., N. Brown, J. Carbajal, et al. (2023) “Rt-2: Vision-Language-Action Models Transfer Web Knowledge to Robotic Control,” arXiv Preprint arXiv:2307.15818.
- Brynjolfsson, E., T. Mitchell, and D. Rock (2018) “What can Machines Learn and What Does it Mean for Occupations and the Economy?” AEA Papers and Proceedings, Vol. 108, pp. 43–47.
- Caliskan, A., J.J. Bryson, and A. Narayanan (2017) “Semantics Derived Automatically from Language Corpora contain Human-like Biases,” Science, Vol. 356, No. 6334, pp. 183–186.
- Carobene, A., A. Padoan, F. Cabitza, G. Banfi, and M. Plebani (2024) “Rising Adoption of Artificial Intelligence in Scientific Publishing: Evaluating the Role, Risks, and Ethical Implications in Paper Drafting and Review Process,” Clinical Chemistry and Laboratory Medicine (CCLM), Vol. 62, No. 5, pp. 835–843.
- Cetin, E., Q. Sun, T. Zhao, and Y. Tang (2024) “An Evolved Universal Transformer Memory,” arXiv Preprint arXiv:2410.13166.
- Christiano, P.F., J. Leike, T. Brown, M. Martic, S. Legg, and D. Amodei (2017) “Deep Reinforcement Learning from Human Preferences,” Advances in Neural Information Processing Systems, Vol. 30.
- Cockburn, I.M., R. Henderson, and S. Stern (2019) “The Impact of Artificial Intelligence on Innovation: An Exploratory Analysis,” in A. Agrawal, J. Gans, and A. Goldfarb (eds.), The Economics of Artificial Intelligence: An Agenda, University of Chicago Press, Chicago, pp. 115–146.
- Crane, L.D. and P.E. Soto (2026) “AI and Coder Employment: Compiling the Evidence,” Federal Reserve Board Working Paper, FEDS 2026018.
- DeepSeek-AI, A. Liu, B. Feng, B. Xue, et al. (2024) “DeepSeek-V3 Technical Report,” arXiv Preprint. Available at: https://arxiv.org/abs/2412.19437.
- Dell, M. (2025) “Deep Learning for Economists,” Journal of Economic Literature, Vol. 63, No. 1, pp. 5–58.
- Eloundou, T., S. Manning, P. Mishkin, and D. Rock (2024) “GPTs are GPTs: Labor Market Impact Potential of LLMs,” Science, Vol. 384, No. 6702, pp. 1306–1308.
- Felten, E.W., M. Raj, and R. Seamans (2019) “The Occupational Impact of Artificial Intelligence: Labor, Skills, and Polarization,” Working Paper, NYU Stern School of Business.
- Feng, D., X. Wei, L. Rosenbaum, A. Maki, and K. Dietmayer (2019) “Deep Active Learning for Efficient Training of a Lidar 3d Object Detector,” in 2019 IEEE Intelligent Vehicles Symposium (IV), IEEE, pp. 667–674.
- Gentzkow, M., B. Kelly, and M. Taddy (2019) “Text as Data,” Journal of Economic Literature, Vol. 57, No. 3, pp. 535–574.
- Gerstgrasser, M., R. Schaeffer, A. Dey, R. Rafailov, H. Sleight, J. Hughes, T. Korbak, R. Agrawal, D. Pai, A. Gromov, D.A. Roberts, D. Yang, D.L. Donoho, and S. Koyejo (2024) “Is Model Collapse Inevitable? Breaking the Curse of Recursion by Accumulating Real and Synthetic Data,” arXiv Preprint arXiv:2404.01413.
- Goldfarb, A., B. Taska, and F. Teodoridis (2023) “Could Machine Learning be a General Purpose Technology? A Comparison of Emerging Technologies Using Data from Online Job Postings,” Research Policy, Vol. 52, No. 1, article 104653.
- Gu, A. and T. Dao (2023) “Mamba: Linear-time Sequence Modeling with Selective State Spaces,” arXiv Preprint arXiv:2312.00752.
- Handa, K., A. Tamkin, M. McCain, S. Huang, E. Durmus, S. Heck, J. Mueller, J. Hong, S. Ritchie, T. Belonax, K.K. Troy, D. Amodei, J. Kaplan, J. Clark, and D. Ganguli (2025) “Which Economic Tasks are Performed with AI? Evidence from Millions of Claude Conversations,” arXiv Preprint arXiv:2503.04761.
- Hart, G.L.W., T. Mueller, C. Toher, and S. Curtarolo (2021) “Machine Learning for Alloys,” Nature Reviews Materials, Vol. 6, No. 8, pp. 730–755.
- Hinton, G., O. Vinyals, and J. Dean (2015) “Distilling the Knowledge in a Neural Network,” arXiv Preprint arXiv:1503.02531. Available at: https://arxiv.org/abs/1503.02531.
- Ho, A., T. Besiroglu, E. Erdil, D. Owen, R. Rahman, Z.C. Guo, D. Atkinson, N. Thompson, and J. Sevilla (2024) “Algorithmic Progress in Language Models,” arXiv Preprint arXiv:2403.05812.
- Iansiti, M. and K.R. Lakhani (2020) Competing in the Age of AI: Strategy and Leadership when Algorithms and Networks run the World, Harvard Business Press, Cambridge, Massachusetts.
- Jacobs, R.A., M.I. Jordan, S.J. Nowlan, and G.E. Hinton (1991) “Adaptive Mixtures of Local Experts,” Neural Computation, Vol. 3, No. 1, pp. 79–87.
- Jiang, A.Q., A. Sablayrolles, A. Mensch, C. Bamford, D.S. Chaplot, D. de las Casas, F. Bressand, G. Lengyel, G. Lample, L. Saulnier, L.R. Lavaud, M.-A. Lachaux, P. Stock, T. Le Scao, T. Lavril, T. Wang, T. Lacroix, and W. El Sayed (2023) “Mistral 7B,” arXiv Preprint arXiv:2310.06825.
- Johnson, S. (2024) “NotebookLM Gets a New Look, Audio Interactivity and a Premium Version,” Google: The Keyword, December 13, available at: https://blog.google/innovation-and-ai/models-and-research/google-labs/notebooklm-new-features-december-2024/.
- Kalidindi, S.R., M. Buzzy, B.L. Boyce, and R. Dingreville (2022) “Digital Twins for Materials,” Frontiers in Materials, Vol. 9, article 818535.
- Kane, A. and M.N. Baily (2025a) “AI in the Electricity Sector: Optimizing Grid Management and Energy Use,” Brookings Institution.
- Kane, A. and M.N. Baily (2025b) “AI in the Information Sector: Advancing Software, Customer Service, and Design,” Brookings Institution.
- Kaplan, J., S. McCandlish, T. Henighan, T.B. Brown, B. Chess, R. Child, S. Gray, A. Radford, J. Wu, and D. Amodei (2020) “Scaling Laws for Neural Language Models,” arXiv Preprint arXiv:2001.08361.
- Korinek, A. (2023) “Generative AI for Economic Research: Use Cases and Implications for Economists,” Journal of Economic Literature, Vol. 61, No. 4, pp. 1281–1317.
- Krizhevsky, A., I. Sutskever, and G.E. Hinton (2012) “ImageNet Classification with Deep Convolutional Neural Networks,” Advances in Neural Information Processing Systems, Vol. 25.
- Li, K., A.K. Hopkins, D. Bau, F. Vi\'{e}gas, H. Pfister, and M. Wattenberg (2022) “Emergent World Representations: Exploring a Sequence Model Trained on a Synthetic Task,” arXiv Preprint arXiv:2210.13382.
- Lipsey, R.G., K.I. Carlaw, and C.T. Bekar (2005) Economic Transformations: General Purpose Technologies and Long-term Economic Growth, OUP Oxford.
- Liu, G., F.A. Reda, K.J. Shih, T.-C. Wang, A. Tao, and B. Catanzaro (2018) “Image Inpainting for Irregular Holes using Partial Convolutions,” in Proceedings of the European Conference on Computer Vision (ECCV), pp. 85–100.
- Liu, R., J. Wei, F. Liu, C. Si, Y. Zhang, J. Rao, S. Zheng, D. Peng, D. Yang, D. Zhou, and A.M. Dai (2024) “Best Practices and Lessons Learned on Synthetic Data for Language Models,” arXiv Preprint arXiv:2404.07503.
- Lugmayr, A., M. Danelljan, A. Romero, F. Yu, R. Timofte, and L. Van Gool (2022) “Repaint: Inpainting using Denoising Diffusion Probabilistic Models,” in Proceedings of the IEEE/CVF Conference on Computer Vision and Pattern Recognition, pp. 11461–11471.
- McKinsey (2024) “The State of AI in Early 2024: Gen AI Adoption Spikes and Starts to Generate Value,” McKinsey & Company.
- Mokyr, J. (2004) The Gifts of Athena: Historical Origins of the Knowledge Economy, Princeton University Press.
- Mowery, D.C. and N. Rosenberg (1999) Paths of Innovation: Technological Change in 20th-Century America, Cambridge University Press, Cambridge, England.
- Nordhaus, W.D. (2007) “Two Centuries of Productivity Growth in Computing,” The Journal of Economic History, Vol. 67, No. 1, pp. 128–159.
- OpenAI (2023) “Introducing GPTs,” November 6, available at: https://openai.com/index/introducing-gpts/.
- Ouyang, L., J. Wu, X. Jiang, D. Almeida, C.L. Wainwright, P. Mishkin, C. Zhang, S. Agarwal, K. Slama, A. Ray, J. Schulman, J. Hilton, F. Kelton, L. Miller, M. Simens, A. Askell, P. Welinder, P. Christiano, J. Leike, and R. Lowe (2022) “Training Language Models to Follow Instructions with Human Feedback,” Advances in Neural Information Processing Systems, Vol. 35, pp. 27730–27744.
- Pairolero, N.A., A.V. Giczy, G. Torres, T.I. Erana, M.A. Finlayson, and A.A. Toole (2025) “The Artificial Intelligence Patent Dataset (AIPD) 2023 Update,” The Journal of Technology Transfer, pp. 1–24.
- Park, J.S., J. O’Brien, C.J. Cai, M.R. Morris, P. Liang, and M.S. Bernstein (2023) “Generative Agents: Interactive Simulacra of Human Behavior,” in Proceedings of the 36th Annual ACM Symposium on User Interface Software and Technology, pp. 1–22.
- Pope, R., S. Douglas, A. Chowdhery, J. Devlin, J. Bradbury, J. Heek, K. Xiao, S. Agrawal, and J. Dean (2023) “Efficiently Scaling Transformer Inference,” Proceedings of Machine Learning and Systems, Vol. 5, pp. 606–624.
- Porter, M.E. and S. Stern (2001) “Innovation: Location Matters,” MIT Sloan Management Review.
- Reed, S., K. Zolna, E. Parisotto, S.G. Colmenarejo, A. Novikov, G. Barth-Maron, M. Gimenez, Y. Sulsky, J. Kay, J.T. Springenberg, T. Eccles, J. Bruce, A. Razavi, A. Edwards, N. Heess, Y. Chen, R. Hadsell, O. Vinyals, M. Bordbar, and N. de Freitas (2022) “A Generalist Agent,” arXiv arXiv:2205.06175.
- Saadi, J.I. and M.C. Yang (2023) “Generative Design: Reframing the Role of the Designer in Early-Stage Design Process,” Journal of Mechanical Design, Vol. 145, No. 4, article 041411.
- Serradilla, O., E. Zugasti, J. Rodriguez, and U. Zurutuza (2022) “Deep Learning Models for Predictive Maintenance: A Survey, Comparison, Challenges and Prospects,” Applied Intelligence, Vol. 52, No. 10, pp. 10934–10964.
- Shazeer, N., A. Mirhoseini, K. Maziarz, A. Davis, Q.V. Le, G.E. Hinton, and J. Dean (2017) “Outrageously Large Neural Networks: The Sparsely-Gated Mixture-of-Experts Layer,” in Proceedings of the 5th International Conference on Learning Representations (ICLR). Available at: https://arxiv.org/abs/1701.06538.
- Shree, P. (2020) “The Journey of Open AI GPT Models,” Walmart Global Tech Blog, November 9, available at: https://medium.com/walmartglobaltech/the-journey-of-open-ai-gpt-models-32d95b7b7fb2.
- Shumailov, I., Z. Shumaylov, Y. Zhao, Y. Gal, N. Papernot, and R. Anderson (2023) “The Curse of Recursion: Training on Generated Data Makes Models Forget,” arXiv Preprint arXiv:2305.17493.
- Tao, F., H. Zhang, and C. Zhang (2024) “Advancements and Challenges of Digital Twins in Industry,” Nature Computational Science, Vol. 4, No. 3, pp. 169–177.
- Taori, R., I. Gulrajani, T. Zhang, Y. Dubois, X. Li, C. Guestrin, P. Liang, and T.B. Hashimoto (2023) “Stanford Alpaca: An Instruction-following Llama Model,” Stanford Center for Research on Foundation Models.
- Trajtenberg, M. (2018) “AI as the Next GPT: A Political-Economy Perspective,” NBER Working Paper 24245, National Bureau of Economic Research.
- Vaswani, A., N. Shazeer, N. Parmar, J. Uszkoreit, L. Jones, A.N. Gomez, L. Kaiser, and I. Polosukhin (2017) “Attention is All You Need,” Advances in Neural Information Processing Systems, Vol. 30.
- Wang, D. and A.-L. Barabási (2021) The Science of Science, Cambridge University Press.
- Wang, H., S. Ma, L. Dong, S. Huang, H. Wang, L. Ma, F. Yang, R. Wang, Y. Wu, and F. Wei (2023) “BitNet: Scaling 1-Bit Transformers for Large Language Models,” arXiv Preprint arXiv:2310.11453.
- Webb, M. (2019) “The Impact of Artificial Intelligence on the Labor Market,” Available at SSRN 3482150.
- Wei, J., X. Wang, D. Schuurmans, M. Bosma, B. Ichter, F. Xia, E. Chi, Q. Le, and D. Zhou (2022) “Chain-of-Thought Prompting Elicits Reasoning in Large Language Models,” Advances in Neural Information Processing Systems, Vol. 35, pp. 24824–24837.
- Whitehead, A.N. (1925) Science and the Modern World: Lowell Lectures, 1925, New American Library.
- Yin, M., H. Vu, and C. Persico (2026) “How (un)Stable Are LLM Occupational Exposure Scores? Evidence from Multi-Model Replication,” NBER Working Paper w35110.
- Zeff, M. (2024) “Current AI Scaling Laws Are Showing Diminishing Returns, Forcing AI Labs to Change Course,” TechCrunch, November 20, available at: https://techcrunch.com/2024/11/20/ai-scaling-laws-are-showing-diminishing-returns-forcing-ai-labs-to-change-course/.
Footnotes
- For a more extensive discussion of the issues in this article, see Baily and Kane (2025a,b); Kane and Baily (2025a,b).
- There is a substantial literature on the question of whether machine learning (ML), which preceded GenAI, is a GPT or an IMI, but little such work on GenAI. Eloundou et al. (2024), an exception, consider the prospects for GenAI to be a GPT based on the prevalence of tasks that appear likely to benefit from GenAI. On ML as a GPT, see Cockburn, Henderson, and Stern, 2019; Trajtenberg, 2018; Bresnahan, 2019; Goldfarb, Taska, and Teodoridis, 2023; Bresnahan, 2024. Cockburn, Henderson, and Stern (2019) consider if ML is an IMI.
- Yin, Vu, and Persico (2026) caution that measures of exposure to AI are highly sensitive to the assumptions used.
- See Bonney et al. (2024) for details about the survey and Bonney et al. (2026) for a more comprehensive exploration of its implications.}
- On the labour market effects of AI, see Acemoglu et al. (2020), Brynjolfsson, Mitchell, and Rock (2018), Felten, Raj, and Seamans (2019), Webb (2019), Eloundou et al. (2024).
- Among these innovations are the Mixture of Experts (MoE) approach — only activating a subset of model parameters (Jacobs et al., 1991; Shazeer et al., 2017); pruning — removing extraneous parameters (Cetin et al., 2024); distillation — compressing large models into smaller ones (Hinton, Vinyals, and Dean, 2015); quantization — reducing numerical precision (Wang et al., 2023); and token caching — storing reusable computations (Pope et al., 2023)
- Specialized chips, such as tensor processing units (TPUs) customized for matrix multiplication, have increased computational efficiency as well.
- The frequent release of new generations of semiconductors belies the difficult challenges faced in achieving each one. The Institute of Electrical and Electronics Engineers regularly publishes “roadmaps” detailing the problems that must be solved for continued improvement in electronics performance (see International Roadmap for Devices and Systems (IRDS™) 2024 Edition https://irds.ieee.org/editions/irds2024/.)
- This approach was taken by the developers of AlexNet, a model which revolutionized the field (Krizhevsky, Sutskever, and Hinton, 2012).
- Some observers have raised concerns that training with synthetic data (and AI-generated text increasingly present on the internet) will yield low-quality or even nonsensical results, a phenomenon known as “model collapse” (Alemohammad et al., 2023; Shumailov et al., 2023). Others have argued that model collapse only occurs when the original training text is replaced by model-generated text (Gerstgrasser et al., 2024).
- Sentiment analysis is possible with earlier forms of AI but the capabilities of GenAI models are vastly greater (Gentzkow, Kelly, and Taddy, 2019; Dell, 2025).
- A useful entry point to this ongoing debate is “LLMs and World Models,” by Melanie Mitchell, February 13, 2025, found at the AI: A Guide for Thinking Humans Substack blog.