Introduction and Methodology
Has economic well-being increased or decreased in recent years, and is it higher or lower in one country compared to others? Traditionally these questions have been answered by looking at trends in and comparisons of GDP per capita, but this is a poor measure of economic well-being. It measures consumption incompletely, ignoring the value of leisure and longer life spans, and it also ignores the value of accumulation for future generations. Furthermore, since it is an average, GDP per capita gives no indication of the likelihood that an individual will share in prosperity nor of the degree of anxiety with which individuals contemplate their futures.
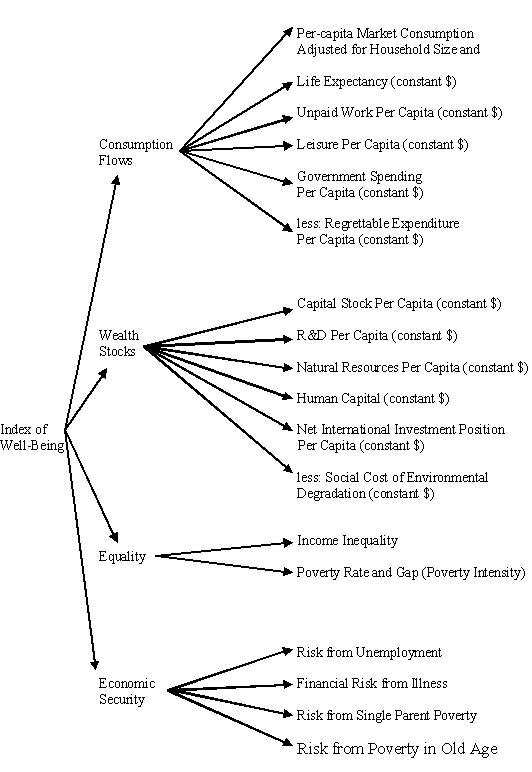
In 1998 the Centre for the Study of Living Standards developed the Index of Economic Well-being, based on a paper written by Lars Osberg for the MacDonald Commission entitled The Measurement of Economic Welfare. It comprises the following four domains of economic well-being:
- Effective per capita consumption flows, including consumption of
marketed goods and services; government services; effective per-capita
flows of household production; leisure; and changes in life span.
- Net societal accumulation of stocks of productive resources, including net accumulation of tangible capital; housing stocks; net changes
in the value of natural resources stocks; environmental costs; net changes
in the level of foreign indebtedness; accumulation of human capital; and the stock of R&D investment.
- Income distribution, including the intensity of poverty (incidence and depth) and the inequality of income.
- Economic security from job loss and unemployment, illness, family breakup, and poverty in old age.
The organization of these four domains and their sub-components within the IEWB is illustrated in the following tree diagram:

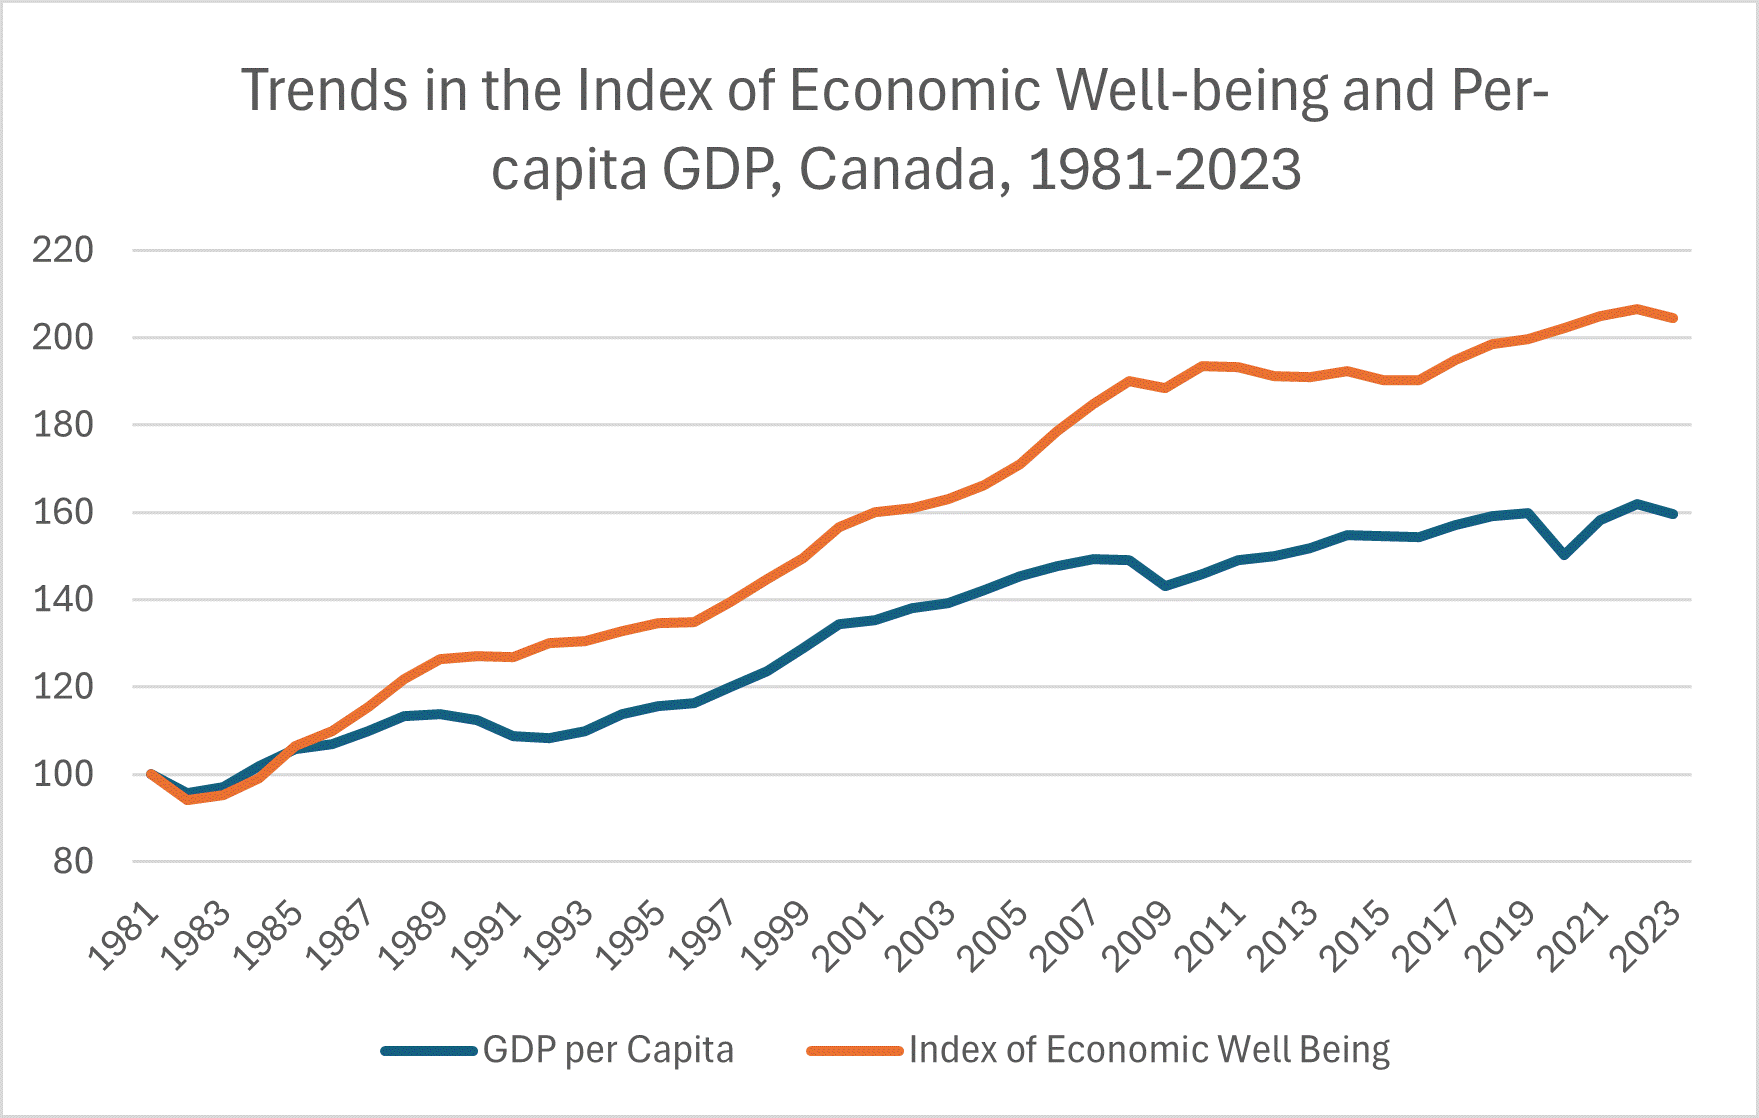
Economic well-being increased 0.62 per cent per year in Canada over the 1981-2023 period. This was below the 1.20 per cent average annual growth of per-capita GDP, the indicator most commonly cited as a metric of economic welfare. Growth of overall economic well-being was slower than per-capita GDP growth throughout the 1980s and 1990s, but the reverse was true in the 2000s. It is clear that the domains of economic well-being that are not included in GDP (equality, security, etc.) have an important impact on the measurement of well-being. The chart below illustrates the trends in the Index of Economic Well-being and per-capita GDP over the 1981-2023 period.

|
|
Both series are normalized to 100 in 1981. Data are from the current IEWB database for Canada and the provinces. See Sharpe and Pietraru (2025). Note that the indices are scaled based on data for Canada and the provinces, not Canada alone.
|
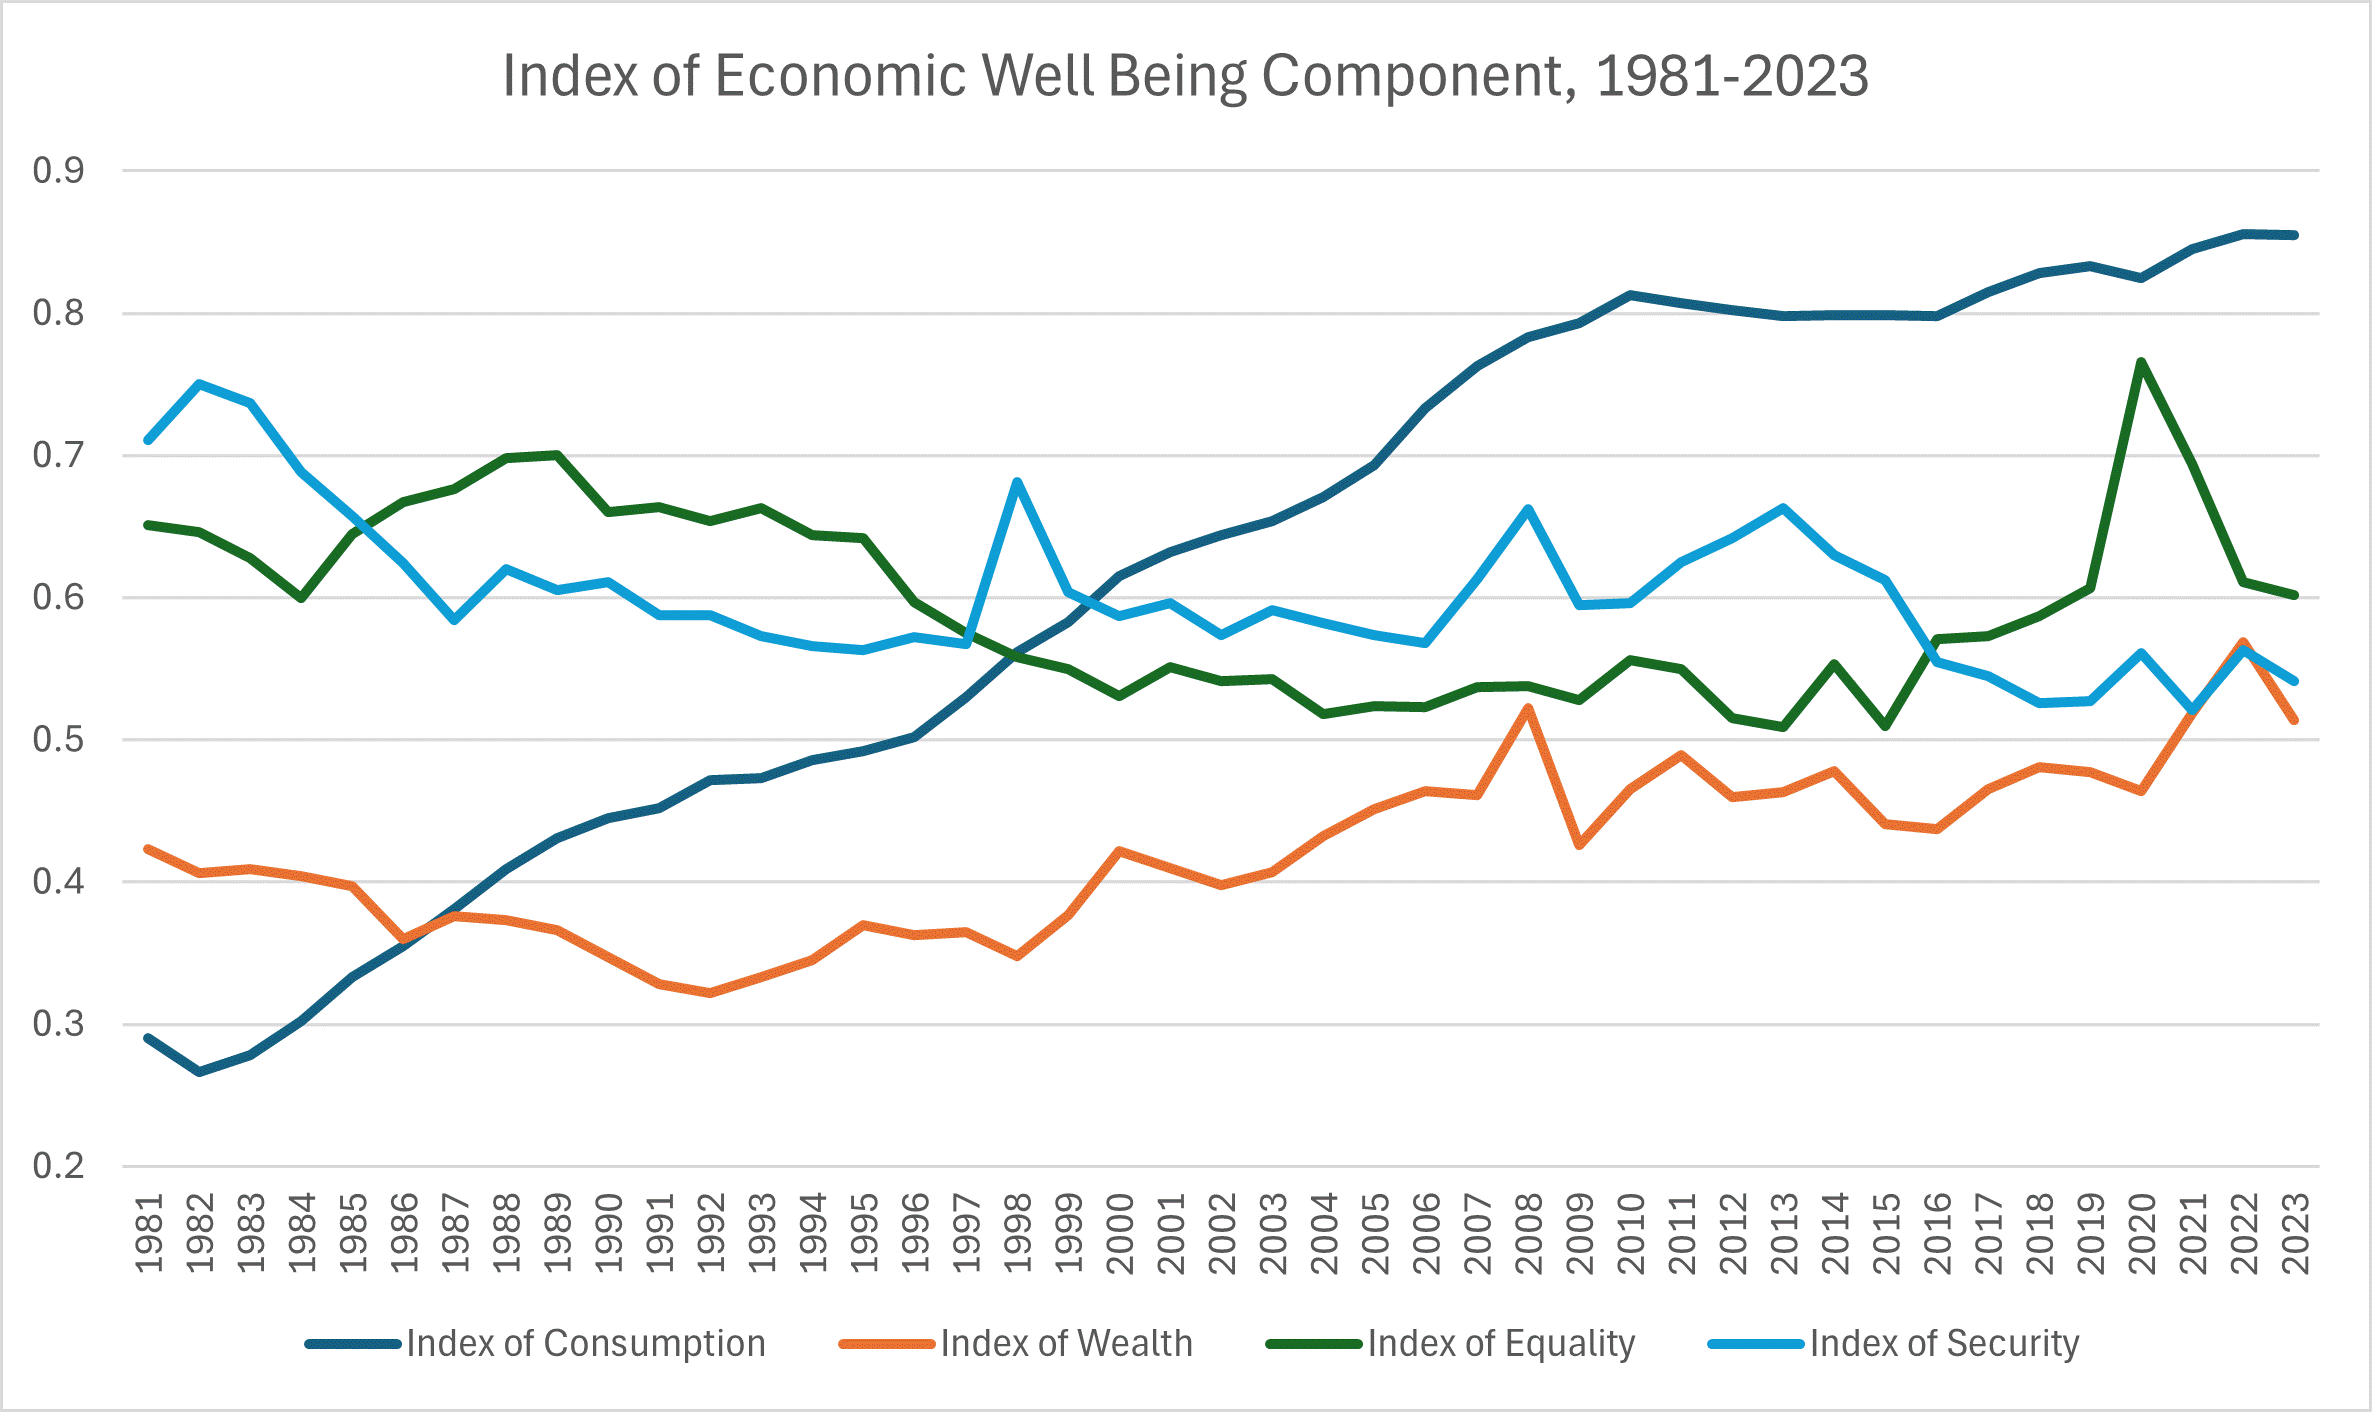
The four domains have experienced different trends in Canada over the 1981-2023 period. Consumption and wealth have grown strongly, but economic equality and security have fallen.

|
|
Trends are measured as absolute changes from the 1981 base. Data are from the current IEWB database for Canada and the provinces. See Sharpe and Pietraru (2025). Note that the indices are scaled based on data for Canada and the provinces, not Canada alone.
|
To combine these four dimensions into a single index it is necessary to specify relative weights for each component. However, since people will generally hold different subjective values as to which dimensions are more important, the goal of the Index of Economic Well-being is to provide a well-organized and manageable set of objective data which individual analysts (who may have different subjective weightings of the components of economic well-being because they have different personal values) can use to come to a summative judgment of social outcomes, i.e. to give individuals a way to "add it all up" and come to their own conclusions on the economic well-being of society.
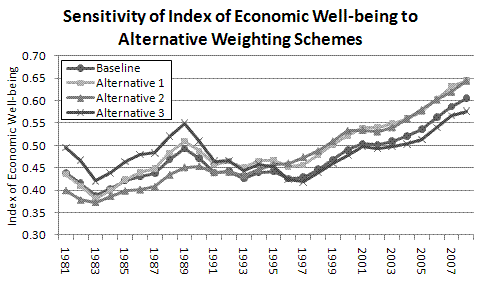
As shown in the chart below, the smaller the relative weight given to the consumption component and the larger the relative weight given to equality and security, the less GDP per capita reflects trends in economic well-being, at least as measured by the Index of Economic Well-being. Unless virtually all weight is given to consumption flows the Index of Economic Well-being advances more slowly than GDP per capita. This tool in Microsoft Excel format allows readers to explore the effects of different subjective weights on trends in the Index for Canada and the provinces. (A corresponding Excel tool for fourteen OECD countries is available here.)

|
Trends are measured as absolute changes from the 1981 base. Data are from the current IEWB database for Canada and the provinces. See Sharpe and Pietraru (2025). Note that the indices are scaled based on data for Canada and the provinces, not Canada alone.
The four weighting schemes are:
Baseline: 0.25*Consumption + 0.25*Wealth + 0.25*Equality + 0.25*Security;
Alternative 1: 0.40*Consumption + 0.10*Wealth + 0.25*Equality + 0.25*Security;
Alternative 2: 0.33*Consumption + 0.33*Wealth + 0.00*Equality + 0.33*Security;
Alternative 3: 0.20*Consumption + 0.10*Wealth + 0.40*Equality + 0.30*Security.
|
Use the links on this web page to access the most recent research produced by the CSLS using the Index of Economic Well-being. Estimates of the Index are available for Canada and the provinces and for fourteen OECD countries.
The Index contains 24 individual components, many of which need to be calculated from multiple underlying variables. Data are available in Canada for all the necessary variables, but estimates of unpaid work, for example, are not available for the United States, and internationally comparable data on some variables are sparse. In order to compare "like with like" we have therefore constructed a number of databases. For each database, the Index is constructed only with the components that are available for all countries in the set (which could be called a "lowest common denominator of availability" methodology). Therefore, for example, the estimates of the Index for Canada from the database for Canada and the provinces are not identical to (and not comparable with) those from the data base for OECD countries.
In 2003 the methodology of the Index was revised to include the linear scaling technique used in measures of social well-being such as the UNDP's Human Development Index. This technique ensures that the data for the countries being compared by the Index have a comparable range. A paper by Julia Salzman discusses in greater depth the importance of this methodological change. Estimates of the Index of Economic Well-being based on the old methodology will remain available by request, but all recent and future work on the Index appearing on this website will incorporate the new methodology. For more detail on this methodology and the construction of the Index of Economic Well-being, please see our articles.
This document is available in Ukranian.
This document is available in Romanian.
This document is available in Malay.
This document is available in Estonian.
This document is available in Czech.
This document is available in Swedish.
This document is available in Russian.
|